What Is Risk Adjusted Return?
Risk-adjusted return is a technique to measure and analyze the returns on an investment for which the financial, market, credit and operational risks are analyzed and adjusted so that an individual can make a decision on whether the investment is worth it with all the risks it poses to the capital invested.
Why do we invest in money? Simple. To reap returns. But have we ever thought if the return is justified enough for the underlying risk factors? While people usually have this perception about money-generating returns, the risk is a oft-forgotten element. Returns are nothing but the gains on the invested surplus: the differential money earned. In purely economic terms, it is a method of considering profits in relation to capital invested.
- Risk-adjusted return is a financial metric that evaluates the return of an investment or portfolio in relation to its level of risk.
- It considers potential gains and the associated risk or volatility, offering a more comprehensive performance evaluation.
- Risk-adjusted return metrics assist investors in comparing investments or portfolios on an equal risk basis, enabling them to make well-informed decisions aligned with their risk preferences.
- Common risk-adjusted return measures include the Sharpe, Sortino, and Treynor ratios, each focusing on different aspects of risk and return to provide a deeper understanding of investment performance.
Risk Adjusted Return Explained
Risk-adjusted return is used in order to measure that how much return an investment portfolio is generating in comparison to the risk involved, which is expressed generally as a number, and the same can be applied to investment funds, individual securities, and the investment portfolios, etc.
Risk-adjusted return varies from person to person and depends on a plethora of factors such as risk tolerance, availability of funds, readiness for holding a position for a long time for market recovery. In case the investor commits a judgment mistake, the opportunity cost of investors and his tax condition will also be ascertained.
There are various ways in which an investor can improve his risk-adjusted return. One of the most common ways of improving risk adjusted return on capital is by adjusting his stock position as per the market volatility. An increase in volatility will usually lead to a decrease in the equities position or vice versa. Fund managers increasingly adopt this strategy to elude large losses and to emphasize maximizing the gains.
However, these measures do not calculate risk adjusted return on a real-time basis. Most of these ratios tend to use the historical risk in a calculation. This is one of the fundamental loopholes that most experts point out. In real life, there can be many latent and unobserved risks that can alter the ranking of investments. One can never calculate the exact risk-adjusted return due to the absence of specific rules. The underlying phenomenon of the use of the risk-adjusted rate of return is that an investor can basically rank them from lowest to highest in terms of attractiveness.
In this article, we discuss Risk-Adjusted Returns in Detail –

How To Calculate?
Risk-adjusted return fine-tunes an investment’s return by measuring how much risk is involved in producing that return. Investment Portfolios are made up of positions in stocks, mutual funds, and ETFs. The concept of risk-adjusted return is used to compare the returns of portfolios with different risk levels against a benchmark with a known return and risk profile.
If an asset has a lower risk quotient than the market, the return of the asset above the risk-free rate is considered a big gain. If the asset depicts a higher than market risk level, the risk-free differential return is reduced.
The risk adjusted return on capital are crucial as it helps to solve three major problems:

The standard definition for investment risk is deviance from an expected outcome. It can be expressed in absolute terms or in relation to something such as a market benchmark. That deviation can either be positive or negative. If an investor plans to achieve higher returns, in the long run, they have to be more open to short-term volatility. The quantum of volatility depends the risk tolerance of an investor. Risk tolerance is nothing but the propensity to take on volatility for specific financial circumstances, considering their psychological, mental ease with uncertainty and the probability of incurring large short-term losses.
Measures
There are mainly six most widely-used methods of calculating risk-adjusted returns. We look at them in detail below –

#1 – Sharpe’s Ratio (Risk Adjusted Return)
The Sharpe ratio meaning how well the return of an asset compensates the investor for the risk taken. When comparing two assets against a common benchmark to calculate risk adjusted return, the one with a higher Sharpe ratio provides a better return for the same risk (or, equivalently, the same return for lower risk). Developed by Nobel Prize winner William F. Sharpe in 1966, the Sharpe ratio is defined as the average return earned in excess of the risk-free rate per unit of volatility or total risk i.e., standard deviation. The Sharpe ratio has become the most widely used method for calculating risk-adjusted returns; however, it can only be accurate if the data has a normal distribution.

- Rp = Expected Portfolio Return
- Rf – Risk Free Rate
- Sigma(p) = Portfolio Standard Deviation
The Sharpe ratio can also help determine whether a security’s excess returns are a result of prudent investment decisions or just too much risk. Even as one fund or security can reap higher returns than its counterparts, the investment can be considered good if those higher returns are free from an element of additional risk. The more the Sharpe ratio, the better is its risk-adjusted-performance as a measure of risk adjusted return.
#2 – Treynor Ratio (Risk Adjusted Return)
Treynor is a measurement of the returns earned in excess of that which could have been earned on an investment that has no diversifiable risk. In short, it is also a reward-volatility ratio, just like the Sharpe’s ratio, but with just one difference. It uses a beta coefficient in place of standard deviations.
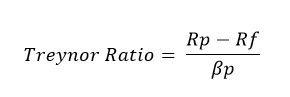
- Rp = Expected Portfolio Return
- Rf – Risk Free Rate
- Beta(p) = Portfolio Beta
This ratio developed as a measure of risk adjusted return by Jack L. Treynor determines how successful an investment is in providing investors compensation, with consideration for the investment’s inherent level of risk. The Treynor ratio depends upon Beta – which depicts the sensitivity of an investment to movements in the market – to evaluate the risk. The Treynor ratio is based on the premise that risk, an integral element of the entire market (as represented by Beta) must be fined because diversification cannot eliminate it.
When the value of the Treynor ratio is high, it is a sign that an investor has generated high returns on each of the market risks he has assumed. The Treynor ratio helps one to understand how each investment within a portfolio is performing. This way, the investor also gains an idea as to how efficiently capital is being utilized.
Also, check out CAPM Beta.
#3 – Jensen’s Alpha (Risk Adjusted Return)
Alpha is often considered an active return on investment. It determines the performance of an investment against a market index used as a benchmark, as they are often considered to represent the market’s movement as a whole. The excess returns of a fund as compared to the return of a benchmark index is the fund’s Alpha. Basically, the alpha coefficient indicates how an investment has performed after accounting for the risk it involved:

- Rp = Expected Portfolio Return
- Rf – Risk-Free Rate
- Beta(p) = Portfolio Beta
- Rm = Market Return
Alpha<0: the investment has earned too little for its risk (or was too risky for the return)
Alpha=0: the investment has earned a return adequate for the risk taken
Alpha>0: the investment has a return in excess of the reward for the assumed risk.
#4 – R-Squared (Risk-Adjusted Return)
R-squared[ is a statistical risk adjusted return on assets measure that represents the percentage of a fund or security’s movements that is based on the movements in a benchmark index.
- R-squared values range from 0 to 1 and are commonly stated as percentages from 0 to 100%.
- An R-squared of 100% means all movements of security can be completely justified by movements in the index.
- A high R-squared, between 85% and 100%, indicates the fund’s performance patterns reflect that of the index.
However, strong outperformance, coupled with a very low R-Squared ratio, will mean more analysis is required to identify the reason for outperformance.
#5 – Sortino Ratio (Risk Adjusted Return)
Sortino ratio is a variation of the Sharpe ratio. Sortino takes the portfolio’s return and divides this by the portfolio’s “Downside risk” Downside risk is the volatility of returns below a specified level, usually the portfolio’s average return or returns below zero. Sortino shows the ratio of return generated “per unit of downside risk.”
Standard deviation includes both the upward as well as downward volatility. However, most investors are primarily concerned about the downward volatility. Therefore, the Sortino ratio depicts a more realistic measure of the downside risk embedded in the fund or the stock as a risk adjusted return on assets.

- Rp = Expected Portfolio Return
- Rf – Risk-Free Rate
- Sigma(d) = Standard Deviation of Negative Asset Returns
#6 – Modigliani Risk-Adjusted Performance
Also known as Modigliani-Modigliani measure or M2, it is used for arriving at the risk-adjusted return of an investment portfolio. It is used for measuring the return from a portfolio adjusted for the risk of the fund/portfolio relative to that of a benchmark (e.g., a specific market or index). It has taken its share of inspiration from the widely accepted Sharpe Ratio; however, it has the significant advantage of being in units of percent return, which makes it easier to interpret.
M2 = Rp – Rm
- Rp is the return on the adjusted portfolio
- Rm is a return on the market portfolio
The adjusted portfolio is the portfolio under management to be adjusted in such a way that it has a total risk as to the market portfolio. The adjusted portfolio is constructed as a combination of the managed portfolio and risk-free asset where weights are assigned according to the risk borne.
The Sharpe ratio can be lead to misleading interpretation when it is negative, and is also difficult to directly compare the Sharpe ratio of several instruments. For instance, if we have one Sharpe ratio of 0.50% and another portfolio with a ratio of -0.50%, the comparison may not make sense between the two portfolios. It is easy to recognize the magnitude of the difference between investment portfolios, which have M2 values of 5.2% and 5.8%. The difference of 0.6% is the risk-adjusted return for the year with the riskiness adjusted to that of the benchmark portfolio.
Examples
Let us understand the concept with the help of some suitable examples.
Example #1
Let’s assume that the 10-year annual return for the S&P 500 (market portfolio) is 10%, while the average annual return on Treasury bills (a good proxy for the risk-free rate) is 5%. The standard deviation is 15% over a 10-year period.
| Managers | Average Annual Return | Portfolio Standard Deviation | Rank |
|---|---|---|---|
| Fund A | 10% | 0.95 | III |
| Fund B | 12% | 0.30 | I |
| Fund C | 8% | 0.28 | II |
- Market = (.10-.05)/0.15 =0.33
- (Fund A) = (0.10-.05)/0.95= 0.052
- (Fund B) = (0.12-.05)/0.30 = 0.233
- (Fund C) = (.08-.05)/0.28 = .0.107
Example #2
Let’s assume that the 10-year annual return for the S&P 500 (market portfolio) is 10%, while the average annual return on Treasury bills (a good proxy for the risk-free rate) is 5%.
| Managers | Average Annual Return | Beta | Rank |
|---|---|---|---|
| Fund A | 12% | 0.95 | II |
| Fund B | 15% | 1.05 | I |
| Fund C | 10% | 1.10 | III |
- Market = (.10-.05)/1 = .05
- (Fund A) = (.12-.05)/0.95 = .073
- (Fund B) = (.15-.05)/1.05 = .095
- (Fund C) = (.10-.05)/1.10 = .045
Example #3
Let us assume a portfolio realized a return of 17% in the previous year. The approximate market index for this fund returned 12.5%. The Beta of the fund versus the same index is 1.4, and the risk-free rate is 4%.
Thus, Jensen’s Alpha = 17 – [4 + 1.4 *(12.5-4)]
= 17 – [4 + 1.4* 8.5] = = 17 – [4 + 11.9]
= 1.1%
Given the Beta of 1.4, the fund is expected to be risky than the market index and thus earn more. A positive alpha is an indication that the portfolio manager earned substantial returns to be compensated for the additional risk taken over the course over the year. If the fund had returned 15%, the computed Alpha would be -0.9%. A negative alpha indicates that the investor was not earning enough returns for the quantum of risk, which was borne.
Example #4
Let’s assume Mutual Fund A has an annualized return of 15% and a downside deviation of 8%. Mutual Fund B has an annualized return of 12% and a downside deviation of 5%. The risk-free rate is 2.5%.
The Sortino ratios for both funds would be calculated as:
- Mutual Fund X Sortino = (15% – 2.5%) / 8% = 1.56
- Mutual Fund Z Sortino = (12% – 2.5%) / 5% = 1.18
Risk-Adjusted Returns – Sharpe Ratio Vs Treynor Ratio Vs Jensen’s Alpha
The Treynor ratio, like the Sharpe ratio, is most effectively used as a ranking tool rather than on an individual basis. Investors can compare funds or portfolios of funds with different amounts of market risk to determine how they rank according to risk-adjusted return. The ratio is particularly useful when the portfolios or funds that are compared are benchmarked to the same market index or when a fund is compared with its own benchmark index.
As compared with the Sharpe ratio, the value of the Treynor ratio is relative: Higher is better. Jensen’s Alpha, on the other hand, can be used only in an absolute context. The sign and size of Alpha reflect the fund manager’s skills and expertise. However, for any measure to be effective, the benchmark index must be chosen appropriately for the portfolio under consideration.
Many a time a manager may appear expert on a reward-to-systematic-risk basis but unskilled on a reward-to-total-risk basis. An investor comparing the Treynor ratio and the Sharpe ratio of a fund has to understand that a major difference between the two can actually be indicative of a portfolio with a significant proportion of characteristic risk in relation to the total risk. On the other hand, a fully diversified portfolio will be ranked identically according to the two ratios.
Jensen’s Alpha
| Managers | Average Annual Return | Beta | Rank |
|---|---|---|---|
| Fund A | 12% | 0.95 | II |
| Fund B | 15% | 1.05 | I |
| Fund C | 10% | 1.10 | III |
First, we calculate the portfolio’s expected return:
- ER (A) =0.05+0.95*(0.1-0.05) =0.0975 or 9.75%
- ER (B) =0.05+1.05*(0.1-0.05) =0.1030 or 10.30% return
- ER (C) ==0.05+1.1*(0.1-0.05) =0.1050 or 10.50% return
Then, we calculate the portfolio’s Alpha by subtracting the expected return of the portfolio from the actual return:
- Alpha A = 12%- 9.75% = 2.25%
- Alpha B = 15%- 10.30% = 4.70%
- Alpha C = 10%- 10.50% = -0.50%
Frequently Asked Questions (FAQs)
1. How is risk-adjusted return different from regular return?
Risk-adjusted return differs from regular return by considering the level of risk or volatility associated with an investment. Regular return measures the gain or loss on an investment, while risk-adjusted return considers the level of risk taken to achieve that return. It provides a more comprehensive assessment of investment performance by factoring in the risk element.
2. What are the limitations of using risk-adjusted return measures?
Limitations of using risk-adjusted return measures include the dependence on historical data, the use of subjective assumptions in risk models, and the inability to predict future market conditions accurately. Risk-adjusted return measures also may not capture all forms of risk, such as systemic or unforeseen risks.
3. Can a risk-adjusted return be used as the sole metric for making investment decisions?
While risk-adjusted return is a valuable metric, it should not be used as the sole factor for making investment decisions. Other considerations should also be considered, such as investment objectives, time horizon, diversification, liquidity needs, and personal risk tolerance. In addition, the risk-adjusted return provides insights into the trade-off between risk and return. Still, it should be used with other relevant metrics and comprehensive analysis for making well-informed investment decisions.
Recommended Articles
This has been a guide to what is Risk Adjusted Return. We explain how to calculate the ratio, different measures along with their examples. You may learn more about financing from the following articles –