Sortino Ratio Meaning
Sortino ratio is the tool that assesses the performance of an investment for each unit of downside risk involved in the deal. The downside risk is calculated per the loss a portfolio is expected to record based on the market fluctuations.
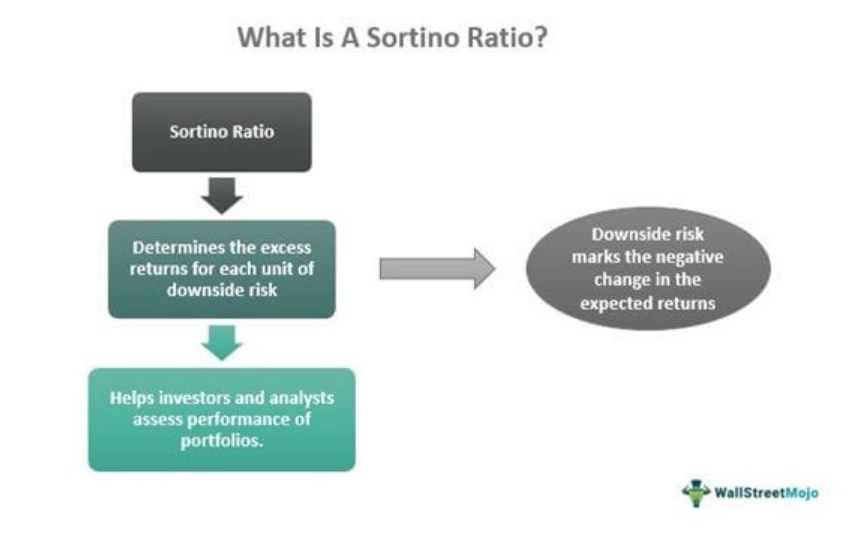
The ratio, in simple words, helps determine additional returns that investors might generate for each unit of downside risk in the market. It is similar to other performance metrics, like the Sharpe and Treynor ratios. The only difference is in the computation of risk, which is not the total risk but only the risk associated with downward price movement.
- Sortino ratio is yet another portfolio performance tool that helps investors and analysts assess the excess returns expected for each unit of downside risk they take.
- The higher the ratio, the better the expected performance of the portfolio.
- It is preferred over other risk-adjusted return assessment tools as it considers only the downside deviation and not the total volatility, which includes both upside and downside risks.
- A negative ratio suggests that investors will receive no rewards for the risks taken.
Understanding Sortino Ratio
Sortino ratio is obtained when users, who are mostly investors, take into account only the downside risk and not the total risk, which includes both the upside and downside deviations. It is, therefore, considered a more effective method of calculating risk-adjusted returns.
Through this ratio, they get an opportunity to determine the additional returns they can expect from an investment for every unit of downside deviation, which is concerned with the expected loss it is likely to incur concerning the market fluctuations.
Investors who spend on mutual funds and other financial instruments are more concerned about the downward volatility as they know a positive fluctuation will only reap profits for them. Hence, studying the downside risk becomes more important than figuring out the overall market volatility.
With this ratio, the investors can assess the excess returns, particularly for each unit of downside risk. This gives them a better and clearer picture of returns that a particular investment may generate. As a result, they get a chance to make well-informed and wise decisions.
A high Sortino ratio indicates better excess returns despite the expected downward volatility. Its only limitation is that there should be enough bad volatility events to calculate a downward deviation to be statistically significant.
Formula
To calculate the Sortino ratio, investors must be aware of the actual or expected returns on the investments, the rate of returns on the investment of the same value without risk also termed risk-free returns, and the downside deviation.
Investors can use these details and put the figures in the Sortino ratio formula below:

Here ’R’ is the value of the expected portfolio returns, while ‘r’ is the rate of return for a risk-free investment.
Example
Suppose there are two different investment portfolio schemes, A and B, with 10% and 15% annualized returns, respectively. Assuming that the downward deviation of A is 4%, whereas for B is 12%. Also, considering the fixed deposit risk-free rate of 6%.
- Sortino ratio calculation for A is: (10-6)/4 = 1
- Sortino ratio calculation for B is: (15-6)/12 = 0.75
Even though B has a greater annual return than A, its ratio is less than the latter. So, suppose investors are more concerned about the downside risks associated with the scheme than the expected returns. In that case, they will go for scheme A as it earns more return per unit of bad risk and has a greater probability of avoiding any large loss.
Uses
Investors, analysts, portfolio managers, or whoever desires to assess the extent of excess return on each unit of negative deviation can use Sortino ratios. The ratio effectively differentiates between good and bad variances by calculating a downward deviation, helping retail investors with specific goals make effective investment decisions, keeping the target rates of return in mind.

It also acts as a useful tool for portfolio or fund managers, allowing them to measure their performance. It ignores all the positive variances and provides a more accurate picture of returns considering the market volatility.
Sharpe Ratio vs Sortino Ratio
Sortino and Sharpe ratio formula are similar in almost all aspects, given the purpose they fulfill. Both these ratios help investors check how a portfolio or asset is likely to perform despite the market fluctuations. As a result, they focus on the volatility and derive respective results, be it assessing the risk or additional returns.

The Sharpe ratio determines the returns based on the total volatility in the market, which includes upside and downside risks. On the other hand, the Sortino ratio only considers the downside risks for assessing additional returns.
As the downside risk is a major concern for investors, they prefer Sortino ratios. The choice, however, will depend on individual investors and their goals, objectives, and convenience.
Frequently Asked Questions (FAQs)
What is a Sortino ratio in mutual funds?
It is a statistical tool used to evaluate the returns from the investment for a given level of bad risk. This ratio is used by analysts and investors to predict how a portfolio would perform. As a result, decision-making becomes easier for them.
What is a good Sortino ratio?
A ratio between 1 and 2 is considered ideal. However, there are instances where the ratio might also reach 3, and, in some instances, investors might be fine with values slightly less than 1 too. In addition, one might obtain a negative ratio, suggesting no rewards for the risks taken.
How to calculate the Sortino ratio?
To obtain this ratio, the users first find the difference between the actual or expected returns from the investment and the rate of return from risk-free investments. Then, they divide the value by the downside deviation in the expected returns.
Recommended Articles
This is a guide to what is Sortino Ratio and its meaning. Here we explain how it works with mutual funds along with its formula, examples, and uses. You can learn more about it from the following articles –