Part of our Investment Performance Metrics guide
What Is Portfolio Variance?
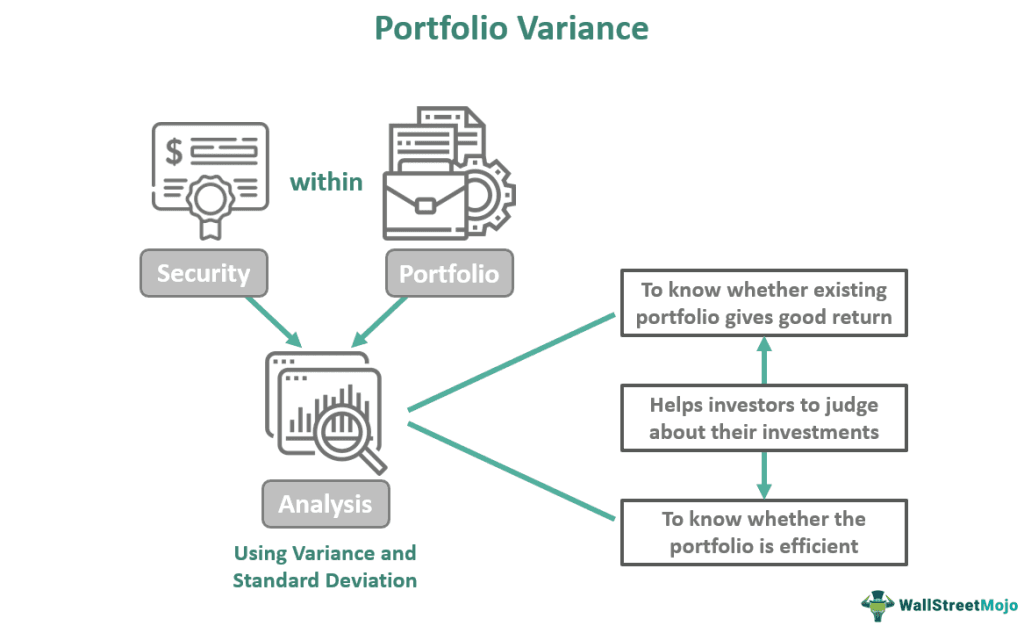
Portfolio variance refers to a procedure of identifying the extent of risk or volatility related to an investment portfolio. Its primary objective is assessing whether the existing combination of securities portfolios has generated the best overall return. It also helps calculate the efficiency of securities in the existing portfolio.
It utilizes the formula of return variance and covariance related to every security in the portfolio and the ratio or percentage of a portfolio represented by every security. It also helps investors evaluate how their assets lead to fulfilling their financial goals. In addition, portfolio variance measurement helps an investor sustain and maintain the mix of assets constituting the portfolio.
- Portfolio variance can be defined as a metric for risks associated with securities forming a portfolio for an investor.
- Its formula has been helpful in determining whether an investment portfolio has a manageable level of risk that can also give good returns in a sequential manner. Another method has been using the MMULT function for a set of data of a company.
- It has a value greater than the standard deviation of a portfolio because it is the square of the deviation. Thereby, its units get expressed in square units, whereas standard deviation has the same unit as the data or security.
- Both standard and variance form an integral part of tools for traders and investors in determining the volatility of markets leading to balanced and safe investment decisions.
Portfolio Variance Explained
Portfolio variance can be defined as a metric of dispersion related to a portfolio. To understand this, one must know about covariance and return variance. Covariance can be taken as the relationship between any two random variables. At the same time, return variance oversees the rate of return given by security concerning others comprising the portfolio. Thus, covariance measures the degree of relationship between any security within a portfolio. Hence, by combining the covariance and return of variance, one gets to:
- Identify the process through which manner securities get working within a portfolio to enhance the value of a portfolio.
- And investigate how any particular assets have been hindering the growth path of any portfolio.
Investing time into the identification of the rate of portfolio variance embedded in any portfolio has certain advantages. They are:
- It provides an investor with the best way to manage the balance of the assets inside a portfolio. It also enables an investor to reduce the impact of downward spiraling in a particular security market concerning the portfolio. Also, if a balance gets maintained, then it allows the bond issues and commodities to thwart any financial losses. At the same time, the security trading in a market goes for a temporary loss.
- It also acts as a benchmark for investors in achieving financial goals using portfolio investment. For example, suppose an investor comes to that their plan of reaching their goal does not meet the originally projected growth of their funds. In that case, they can opt for restructuring the portfolio so that they can replan its structure for proper growth. In addition, the new plan may comprise selling some securities, buying and acquiring new security, or keeping the current portfolio the same and buying new securities. Another way one may also enhance the portfolio variance is by – transposing securities from one portfolio to another, increasing the share of profitable security in the overall valuation of the portfolio.
Examples
Let us look at some examples to understand the minimum portfolio variance’s implication, importance, and meaning:
Example # 1
Let us assume Noah has two assets – security A & B in its portfolio. The portfolio has the following details:
| Security | Weight | Expected return | Standard deviation |
|---|---|---|---|
| A | 0.5 | 21% | 9 |
| B | 0.5 | 11% | 17 |
| Correlation | 0.6 |
The formula (assuming n assets) is:
Variance of Portfolio = w₁² * Var₁ + w₂² * Var₂ + … + wₙ² * Varₙ + 2 * w₁ * w₂ * Cov₁₂ + … + 2 * w₁ * wₙ * Cov₁ₙ + 2 * w₂ * w₃ * Cov₂₃ + … + 2 * wₙ₋₁ * wₙ * Covₙ₋₁ₙ
For the above data and using the formula, one gets the value of standard deviation as
σ p = 11.09%.
It means that the portfolio containing these securities A & B has an expected return of 16.9% and a portfolio risk of 11.09%.
Example # 2
In our next example, the portfolio has two securities XYZ & ABC. XYZ has 70% weight, and ABC has 30% weightage in the portfolio. Moreover, the standard deviation for:
XYZ= 0.15
ABC= 0.17
Both have a correlation value of 80% or 0.8 between them.
Hence by using the minimum portfolio variance formula :
Variance = (.7 x .172) + (.3 x.152) + 2(.7 x .3 x .8 x .17 x .15) = .0355
After using the above value of variance, one gets the standard deviation of the portfolio as:
Portfolio standard deviation = (.0355) ^1/2 = .188 or 18.8%. We can also find this value by using the portfolio variance calculator either online or in Excel.
Portfolio Variance & Portfolio Standard Deviation
Let us understand the difference between portfolio variance & portfolio standard deviation using the table below:
| Portfolio Variance | Portfolio Standard Deviation |
|---|---|
| It gets deduced by the squaring of Portfolio Standard Deviation | It gets deuced by taking out the square root of the portfolio variance. |
| With the growth of the number of assets within a portfolio, the terms used in the variance formula also increase exponentially. | It does not show any such growth. |
| It gets expressed in square units. | Standard deviation could be expressed in the original units of the data. |
| It shows how far security in a portfolio gets spread out. | This shows how much the observations of security differ from its portfolio mean. |
| It has a value always greater than the portfolio standard deviation. | This has a value always smaller than the variance of a portfolio. |
| It helps in getting a glimpse of the risk associated with a portfolio using the deviation value. | The portfolio becomes less risky when the security groups cluster together near the mean. |
Frequently Asked Questions (FAQs)
1.How to calculate portfolio variance in Excel?
One can use the traditional method to calculate it, like applying the Portfolio Weight of Stocks plus the standard deviation of reference stock and the correlation between the stocks.
2.Can portfolio variance be negative?
We can calculate portfolio variance using the standard deviation measure of every security contained in the portfolio and their relation with each other in the portfolio. It has to be positive always as it has been defined as the second central moment related to mean.
3.To what extent can diversification reduce portfolio variance?
It gets estimated that a limit has been defined up to which variance gets reduced by portfolio diversification. Thus, in an approximation, the number of securities required to reduce the portfolio variance depends entirely on the market conditions. For example, to achieve an 80% reduction in variance, one needs 16 on ASX.
Recommended Articles
This has been a guide to what is Portfolio Variance. Here, we explain the topic in detail with its examples & comparison with portfolio standard deviation. You can learn more about it from the following articles –
Recommended Articles
Continue with these closely related articles from the same guide.