Table Of Contents
Kurtosis Meaning
Kurtosis in statistics describes the distribution of the data set. It depicts to what extent the data set points of a particular distribution differ from the data of a normal distribution. In addition, one may use it to determine whether a distribution contains extreme values. It is a measure of tailedness within a distribution.
In probability and statistics, this metric helps understand the tailedness of a probability of distribution within a set of real-value random variables. It measures is the data is heavy-tailed or light-tailed in relation to a normal distribution. Data points with excess kurtosis tend to have heavy tails and low Kurtosis tend to have light tails.
Key Takeaways
- Kurtosis in statistics measures the shape of a dataset's distribution and indicates the extent to which its data points differ from those of a normal distribution.
- Kurtosis can be used to identify whether a distribution contains extreme values or exhibits heavy tails.
- There are three types of kurtosis: mesokurtic (similar to a normal distribution), leptokurtic (higher peak and heavier tails), and platykurtic (lower peak and lighter tails).
- The kurtosis of investment can provide insights into its potential for generating high returns or experiencing significant losses.
Kurtosis Explained
In finance, kurtosis statistics measures the volume of financial risk associated with any instrument or transaction. The more the Kurtosis is, the more financial risk is associated with the concerned data set. Skewness is a measure of symmetry in distribution, whereas Kurtosis measures heaviness or the density of distribution tails.
One may use Kurtosis as a measure to define the risk an investment carries. One can also predict the nature of the investment to generate higher returns from the value of the calculated Kurtosis. The greater the excess for any investment data set, the greater its deviation from the mean.
It means such an investment has the potential to generate higher returns or to deplete the investment value to a greater extent. Excess Kurtosis closer to zero or a flat deviation from the mean depicts that the investment will have a lesser probability of generating high returns. One can use it to define the financial risk of the investment. For investment advisors, Kurtosis is crucial in defining the investment risk associated with the fund's portfolio.
Types
Let us understand the different types of Kurtosis statistics through the explanation below. It is important to understand the different intricacies of the concept and its interpretations.
#1 - Mesokurtic
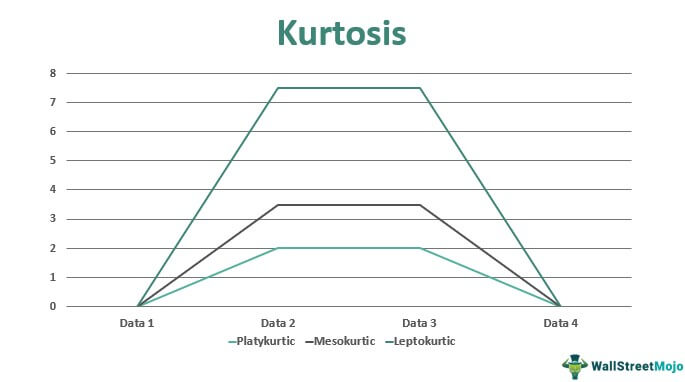
If the Kurtosis of data falls close to zero or equals zero, it is referred to as Mesokurtic. It means that the data set follows a normal distribution. For example, the blue line in the above picture represents a Mesokurtic distribution. In finance, such a pattern depicts risk at a moderate level.
#2 - Leptokurtic
When Kurtosis is positive in other terms, more than zero, the data falls under leptokurtic. Leptokurtic has steep curves on both sides, indicating the large population of outliers in the data set. In finance, a leptokurtic distribution shows that the return on investment may be highly volatile on a huge scale on either side. An investment following leptokurtic distribution is risky, but it can also generate hefty returns to compensate for the risk. The green curve in the above picture represents the leptokurtic distribution.
#3 - Platykurtic
Whenever the Kurtosis is less than zero or negative, it refers to Platykurtic. The distribution set follows the subtle or pale curve, and that curve indicates the small number of outliers in a distribution. An investment falling under Platykurtic is usually in demand by investors because of a small probability of generating an extreme return. Also, the small outliers and flat tails indicate the less risk involved in such investments. The red line in the above graphical representation depicts a platykurtic distribution or a safe investment.
Importance
Let us understand the importance of understanding excess kurtosis and other types in detail to be able to interpret the data in detail. Let us do so through the explanation below.
- From investors' perspective, high Kurtosis of the return distribution implies that an investment will yield occasional extreme returns. It can swing both ways, which are either positive returns or extremely negative returns. Thus, such investment carries high risk. Such a phenomenon is known as Kurtosis risk. The skewness measures the combined size of the two tails. In addition, it measures the distribution among the values in these tails.
- When one calculates the Kurtosis distribution on any data set of a particular investment, the risk of the investment against the probability of generating returns, depending on its value and type it belongs to; the investment advisors can make the investment predictions. Based on the predictions, advisors will advise the strategy and investment plan to the investor, and they will choose to go about the investment. There is a built-in function called Kurt in Excel to calculate Kurtosis in Excel.
Advantages
The wide use of kurtosis statistics is proof enough of the advantages and importance of the concept in statistical analysis and probability. Let us further reiterate the advantages of the concept through the discussion below.
- One may calculate it on the data set of the investment. The value obtained can be used to depict the nature of the investment. Greater deviation from the mean means the returns are also high for that particular investment.
- When the excess Kurtosis is flat, the probability of generating a high return from the investment is low and will generate high returns in only a few scenarios. This is because the return is not so high on the investment so regularly.
- High excess Kurtosis means that the return on the investment can swing both ways. It means the generated returns can either be very high or very low as per the outliers in the distribution. When negative, it indicates that the deviation of the mean data set from the mean is flat.
