What is the Range Formula?
The range formula refers to the formula used to calculate the difference between the maximum and minimum values of the range. According to the formula, the minimum value is subtracted from the maximum value to determine the range.
Range = the maximum value – the minimum value
The given dataset provides statisticians and mathematicians with a better understanding of the data set and how varied it is. Moreover, it is the simplest approach to calculating variance in statistics.
Key Takeaways
- The range formula estimates the range’s maximum and minimum range values.
- Then as per the formula, the minimum value is deducted from the maximum value to calculate the range.
- It is simple and easy to use as the formula mentions that the maximum value is less than the given sample minimum value.
- Hence, the range is the variance between the maximum and minimum values.
- It is simple to use and understand but needs proper interpretation.
- The range formula shows the spread in a given sample or dataset. Moreover, one may utilize it to compare the resultant distance between the same given selection or datasets
Explanation
It is quite simple and easy to use as the formula states its maximum value less the minimum value of the given sample. Therefore, the range is the variance between the maximum and minimum values. However, even though that is simple to use and understand, it requires interpretation properly.
For example, if there is an outlier in the data, the range will be influenced by the same, leading to misrepresentation. Take a practical example for data 2, 4, 7, 7, and 100. Then, the range would be 100 – 2, which is 98, but as one can see that the data range lies below 10, considering and interpreting that data is within 98 will lead to misrepresentation. Hence, one should conduct the interpretation of range with due consideration.
Examples
Example #1
Consider following given dataset 2,2,4,4, 4, 6,7,7,8, 8, 8, 9 ,9, 9, 9, 9. You are required to calculate the Range for this sample.
Solution:
- Maximum value = 9
- Minimum value = 2
Range = 9 – 2
Range = 7
Example #2
Mr. Stark is a scientist who has worked for 10 years with a Dream Moon company. Mr. Arora, his supervisor, is experimenting with human health and has collected a few sample data of male height, which are 162, 158, 189, 144, 151, 150, 151, 178, 155, and 160. He is perplexed now and wants to know how much data is varied. Mr. Stark, an experienced statistician, has been approached by his supervisor Mr. Arora to remove his confusion about the formula variation. Mr. Arora is required to provide an answer to his supervisor. You are required to calculate how much the data varied.
Solution:
Range = maximum value – minimum value
- Maximum value = 189
- Minimum value = 144
Range = 189 – 144
Range = 45
The data or the sample collected has a variation of 45.
Example #3
Mr. Buffet, a well-known and esteemed investor worldwide, is now considering US market stock and is analyzing a few of them in where he wants to invest. The list includes major blue-chip companies in the US. Below are the given shortlisted stocks or securities along with their latest stock market price, denoted in US$, where he is considering investing.
You are required to calculate Range and come up with the variation the list has.
Solution:
Below is given data for calculation of the range.

Using the above information, the calculation of Max Value in excel will be as follows,
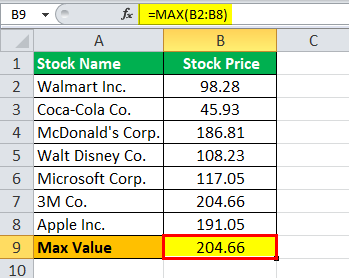
Max Value = 204.66
Calculation of Min Value in excel as follows,
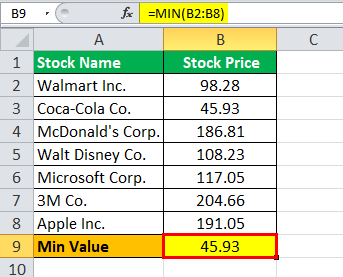
Min Value = 45.93
Therefore, the calculation of range is as follows,

Range = 204.66 – 45.93
The range will be –
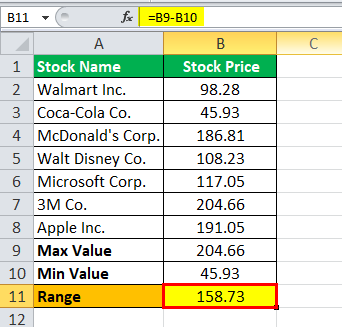
Range = 158.73
Uses of Range Formula
The range is a very easy and basic understanding of how the numbers in the given data set or sample spread out because, as stated earlier, it is relatively easy to calculate since a very basic arithmetic operation is only required to subtract the minimum from the maximum value. Still, the range has few more applications for a given data set or a given sample in statistics. For example, the range is also useful in estimating another measure of spread, called variance or the standard deviation.
The range, as mentioned earlier, can only inform about the basic details, i.e., where the spread of a given sample or set of data will lie. Giving the difference or, say, the variance between the highest and the lowest values of a given sample or given dataset gives information or a rough idea about the significant extreme observations of how widely spread out those are. Still, again it gives no hint or any information as to the other data points where they would lie, which is the main weakness of using the range equation.
The range, as discussed above, is useful for depicting the spread within a given sample or dataset. Further, one may use it to compare the resultant spread between the same given sample or datasets.
Frequently Asked Questions (FAQs)
How to find the range formula in Excel?
One must first insert all the numbers to calculate the range. Then deduct the lowest number from the highest. As a result, it provides the listed range.
What does the range formula mean in Excel?
A range formula means a range of cells in which a formula carries through consistently throughout the whole range. In addition, cell references in this formula can, however, be relative.
How to do a date range formula in Excel?
For arranging the date ranges in Excel, one must initially format the cells with a start and end date as ‘ date.’ Then, they must use the operators: ‘+’ or ‘-‘ to estimate the end date or range duration.
How do you write a range formula in Excel?
One must write the range formula in Excel as Range = Maximum Value–Minimum Value.
Recommended Articles
This article has been a guide to Range Formula. Here, we discuss calculating the range using its formula, Excel examples, and a downloadable Excel template. You can learn more about financing from the following articles: –