Decile Meaning
In descriptive statistics, the term “decile” refers to the nine values that split the population data into ten equal fragments such that each fragment is representative of 1/10th of the population. In other words, each successive decile corresponds to an increase of 10% points that the 1st decile or D1 has 10% of the observations below it. Then, the 2nd decile, or D2, has 20% of the observations below it, and so on.
Decile Formula Excel Template
Download Excel Template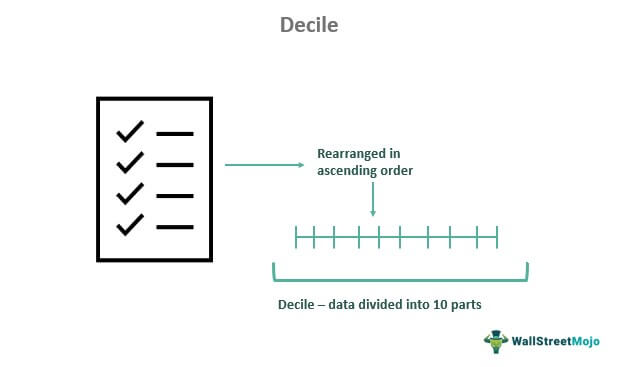
It arranges the data from the lowest to the highest form and each successive value shows an increase of 10%. It is a method to catagorize the numerical data. It is widely used in economics and finance but should be used only after arranging the data in ascending order.
Key Takeaways
- In descriptive statistics, “decile” the nine values that divide the population data into ten equal fragments such that each piece is representative of 1/10th of the population.
- It is essential to know the decile concept since it is broadly used in portfolio management to estimate portfolio performance.
- The ranking compares an asset’s performance with other similar investments. Moreover, the government also uses this approach to assess a nation’s income distribution or income equality level.
- One can utilize this method of dividing data as part of numerous statistical and academic studies in economics and finance.
Decile Explained
Decile rank is a quantitative process of dividing a set of data into tenequal parts. For this purpose, it is necessary to arrange the data systematically in ascending order. It is widely used for statistical study in the economics and finance field.
The primary purpose of the process is to make the data more valuable and easy to comprehend and analyze. First, the analysts try to find the lowest and highest values using this method. Then, ranks are assigned to the data, showing a 10% rise in each successive data. So, there will be nine points in the distribution.
Formula
There are several formulas in vogue to calculate decile. This method is one of the simplest ones where one can calculate each decile by adding one to the number of data in the population, then dividing the sum by ten, and then finally multiplying the result by the rank of the decile, i.e., 1 for D1, 2 for D2… 9 for D9.
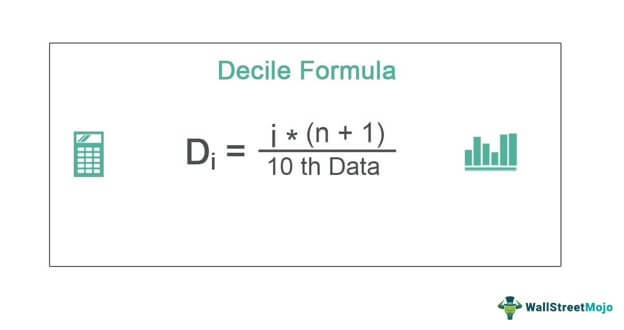
Di = i * (n + 1) / 10 th data
where n = Number of data in the population or sample
i is the ith decile rank represents as,
- 1st decile, D1 = 1 * (n + 1) / 10 th data
- 2nd decile, D2 = 2 * (n + 1) / 10 th data
and so on..
How To Calculate?
Let us follow the below steps to calculate decile.
Firstly, determine the number of data or variables in the population or sample, denoted by n.
Next, sort all the data or variables in the population in ascending order.
Next, based on the required decile, determine the value by adding one to the number of data in the population, divide the sum by ten and then multiply the result by the rank of the decile as shown below.
ith decile, Di formula = i * (n + 1) / 10 th dataFinally, based on the decile value, figure out the corresponding variable from among the data in the population.
Examples (with Excel Template)
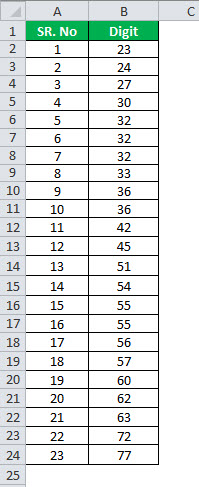
Let us suppose that John has given a set of unsorted data points. He has asked to sort the numbers and cut them into 10 equal sections. So, help John sort the following 23 random numbers valued from 20 to 78 and present them as decile grouped data. The raw numbers are:24, 32, 27, 32, 23, 62, 45, 77, 60, 63, 36, 54, 57, 36, 72, 55, 51, 32, 56, 33, 42, 55, 30.
Given,
- n = 23
Firstly, sort the 23 random numbers in the ascending order like below,
23, 24, 27, 30, 32, 32, 32, 33, 36, 36, 42, 45, 51, 54, 55, 55, 56, 57, 60, 62, 63, 72, 77
So, the calculation can be as follows:

Similarly, we can calculate each decile as shown above,
Now, D1 = 1 * (n + 1) / 10 th data = 1 * (23 + 1) / 10
= 2.4th data i.e. between digit no. 2 and 3
which is = 24 + 0.4 * (27 – 24) = 25.2
Again, D2 = 2 * (23 + 1) / 10 th data
= 4.8th data i.e. between digit no. 4 and 5
which is = 30 + 0.8 * (32 – 30) = 31.6
Again, D3 = 3 * (23 + 1) / 10 th data
= 7.2th data i.e. between digit no. 7 and 8
which is = 32 + 0.2 * (33 – 32) = 32.2
Again, D4 = 4 * (23 + 1) / 10 th data
= 9.6th data i.e. between digit no. 9 and 10
which is = 36 + 0.6 * (36 – 36) = 36
Again, D5 = 5 * (23 + 1) / 10 th data
= 12th data i.e. digit no. 12
which is 45
Again, D6 = 6 * (23 + 1) / 10 th data
= 14.4th data i.e. between digit no. 14 and 15
which is = 54 + 0.4 * (55 – 54) = 54.4
Again, D7 = 7 * (23 + 1) / 10 th data
= 16.8th data i.e. between digit no. 16 and 17
which is = 55 + 0.8 * (56 – 55) = 55.8
Again, D8 = 8 * (23 + 1) / 10 th data
= 19.2th data i.e. between digit no. 19 and 20
which is = 60 + 0.2 * (62 – 60) = 60.4
Again, D9 = 9 * (23 + 1) / 10 th data
= 21.6th data i.e. between digit no. 21 and 22
which is = 63 + 0.6 * (72 – 63) = 68.4
The decile will be:

Therefore, the value is as follows –

D1 =25.2
Relevance and Uses
It is very important to understand the concept of decile in statistics because it is widely used in the field of portfolio management to assess the performance of a portfolio. The ranking helps to compare the performance of an asset with other similar assets. The government also uses the decile grouped data to determine a nation’s income distribution or level of income equality. One can use this method of dividing data as part of many statistical and academic studies in economics and finance.
You can download this Template from here – Decile Formula Excel Template.
Decile Vs Percentile
Decile in statistics divides a set of data into 10 parts and percentile divides a set of data into 100 parts. But let us look at the differences between them in details.
| Decile | Percentile |
|---|---|
| It divides data into 100 equal parts. | It divides data into 100 equal parts. |
| It is denoted by D1, D2, D3, etc. | It is divided into P1, P2, P3, etc. |
| In decile, median is the 5th position. | In percentile, median is the 50th position. |
Frequently Asked Questions (FAQs)
How to find the decile of ungrouped data?
Decile formula for ungrouped data: D(x) = Value of the x(n+1)10 x ( n + 1 ) 10th term in the data set. In this formula, x is the decile value that must be calculated and ranges from 1 to 9. In addition, n means the total number of observations in that data set.
What are income deciles?
In a distribution of personal or family income ordered by income growth volume, the deciles are nine income figures dividing the population or families into ten equal parts, each displaying 10% total.
What are the similarities between quartile decile and percentile?
How to do deciles in Excel?
First, order the data from least to most lavish to find the decile. Then, divide the data by 10. It indicates the number of observed Values in every decile.
Recommended Articles
This article is a guide to Decile and its meaning. We explain it along with its formula, examples, how to calculate, differences with percentile and its uses. You can learn more about financial analysis from the following articles: –