Part of our Descriptive Statistics guide
Standard Error Definition
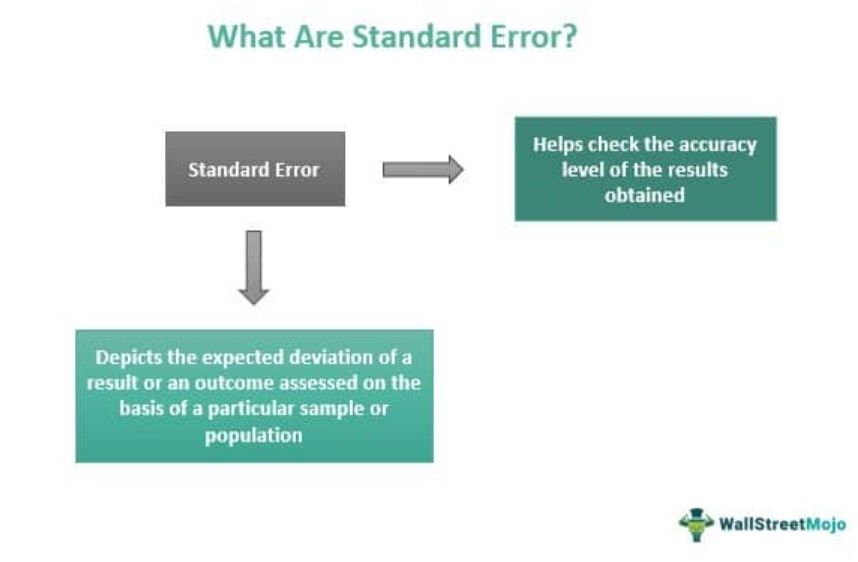
Standard Error or SE measures the accuracy with the help of a sample distribution that signifies a population taking standard deviation into use. In other words, one can understand it as a measure concerning the dispersion of a sample mean concerned with the population means.
The standard error should not be confused with the standard deviation. It is higher because standard errors use sample data or statistics, while standard deviations use parameters or population data.
Key Takeaways
- Standard Error or SE determines the correctness with the help of a sample distribution that indicates a population considering standard deviation into usage.
- One can understand it as a tool regarding the sample mean dispersion concerned with the population means, but it should not be confused with standard deviation.
- It is higher since standard errors utilize sample data or statistics. In contrast, standard deviations use parameters or population data.
- It functions similarly to descriptive statistics, allowing the researcher to build confidence intervals concerning the sample statistics already obtained.
Standard Error Explained
The standard error measures the accuracy of a mean and an estimate. It offers a useful way for the quantification of a sampling error. S.E. is useful since it represents the total amount of sampling errors associated with the sampling processes. The standard error of the estimate and standard error of the mean are two commonly used SE statistics.
The standard error of the estimate allows for making predictions but doesn’t indicate the prediction’s accuracy. It measures the precision of the regression, whereas the standard error of the mean helps the researcher develop a confidence interval in which the population mean is most likely to fall. One can understand SEM as the statistic or parameter of the mean.
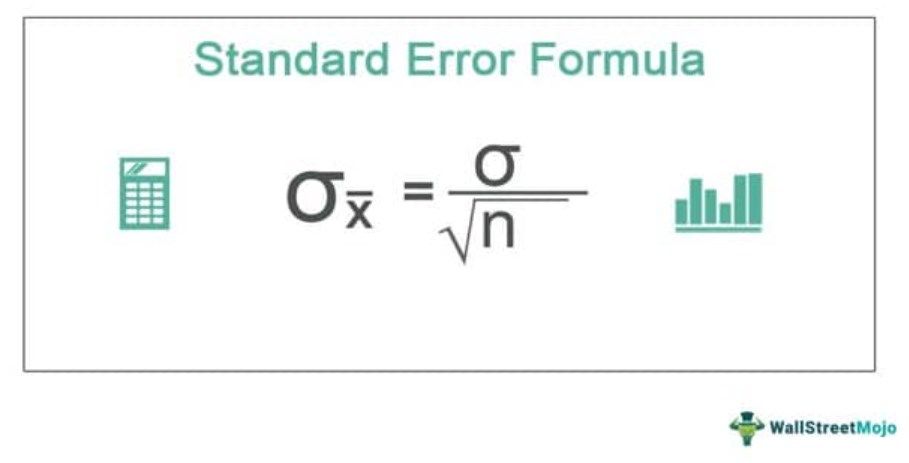
Formula
One may represent it as below:
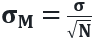
Here, “σM ” represents the S.E. of the mean, which is also the S.D. (standard deviation) of the sample data of the mean, and “N” represents the sample size. At the same time, “σ” signifies the S.D. of the original distribution. Therefore, the S.E formula will not assume N.D. (normal distribution). However, few uses of the formula do assume a normal distribution.
Therefore, this standard error equation signifies that the sample size will have an inverse effect on the S.D. of the mean, i.e., the larger the sample mean, the smaller shall be the S.E. of the same and vice-versa. That is why the size of the S.E. of the mean is inversely proportional to the square root of N (sample size).
How To Find?
The steps to calculate the standard error are as follows:
- In the first step, one must calculate the mean by summing all the samples and then dividing them by the total number of samples.
- In the second step, the deviation for each measurement must be calculated from the mean, i.e., subtracting the individual measurement.
- In the third step, one must square every deviation from the mean. In this way, squared negatives will become positive.
- In the fourth step, one must sum up the squared deviations. For this purpose, one must add all the numbers obtained from Step 3.
- In the fifth step, the sum obtained from the fourth step must divide by one digit less than the sample size.
- In the sixth step, one must take the square root of the number obtained in the fifth step. The result shall be S.D. or standard deviation.
- One must calculate S.E by dividing the standard deviation by the square root of the N (sample size).
- In the last step, subtract the S.E. from the mean. Accordingly, one must record that number. Then, add the S.E. to the mean, and record the result.
Examples
Below are examples of standard errors.
Example #1
Cancer mortality in a sample of 100 is 20 percent, and in the second sample of 100 is 30 percent. Evaluate the significance of the contrast in the mortality rate.
Solution
Use the below-given data.
- =SQRT(20*80/(100)+(30*70/(100)))
- =6.08
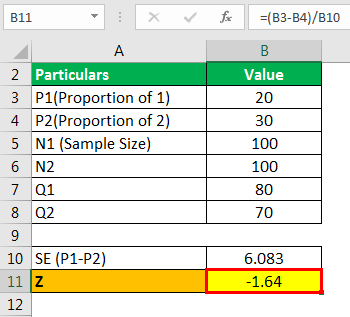
- Z= 20-30/6.08
- Z= -1.64
Example #2
They chose a random sample of 5 male basketball players. Their heights are 175, 170, 177, 183, and 169 (in cm). First, find the S.E. of the mean of this height (in cm) measurements.
Solution
- = (175+170+177+183+169)/5
- Sample Mean = 174.8
Calculation of Sample Standard Deviation
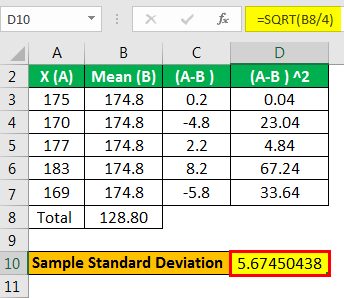
- =SQRT(128.80)
- Sample Standard Deviation =5.67450438
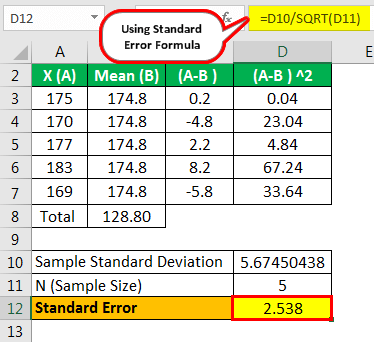
- =5.67450438/SQRT(5)
- = 2.538
Example #3
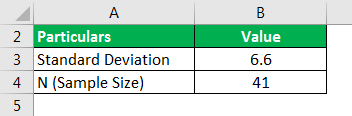
The mean profit earning for a sample of 41 businesses is 19, and the S.D. of the customers is 6.6. First, find the S.E. of the mean.
Solution
Use the below-given data.
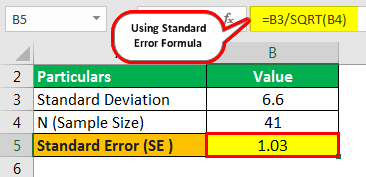
- = 6.6/SQRT(41)
- = 1.03
Interpretation
Standard error functions very similarly to descriptive statistics as it permits the researcher to develop confidence intervals concerning the sample statistics already obtained. In addition, it helps estimate the intervals in which the parameters are supposed to fall. S.E. of the mean and S.E. of the estimate are the two commonly used S.E. statistics.
The S.E. of the mean allows the researcher to develop a confidence interval in which the population means will fall. One may use 1-P as the formula that signifies the probability that the population mean will fall in the confidence interval.
The S.E. of the estimate is mostly taken into use by various researchers. One may use it along with the correlation measure. It allows the researchers to construct a confidence interval underneath the actual population correlation that shall fall. One may use the S.E. of the estimate for determining the preciseness of an estimate concerning population correlation.
S.E. helps indicate the preciseness of an estimate of population parameters of the sample statistics.
Standard Error Vs Standard Deviation
The standard error and standard deviation are two different topics that must not be confused with one another.
- The short form for standard error is S.E., while the abbreviation for standard deviation is S.D.
- S.E. of a sample truly means an estimate of the distance of the sample mean from the population mean, and it helps in gauging the accuracy of an estimate. At the same time, S.D. measures the amount of dispersion or variability. It is generally the extent to which individuals belonging to the same sample differs from the sample mean.
Frequently Asked Questions (FAQs)
What is the difference between standard error and confidence interval?
The standard error and confidence interval are related but distinct concepts. The standard error measures the variability or uncertainty of a sample statistic, such as the sample mean or proportion, and quantifies the precision of the estimate. On the other hand, a confidence interval provides a range of values within which the true population parameter is likely to fall based on the sample data and a chosen level of confidence.
Why is the standard error important?
The standard error is important because it helps assess an estimate’s reliability and precision. A smaller standard error indicates a more precise estimate, meaning it is closer to the true population parameter. Researchers and statisticians use the standard error to determine the level of confidence they can have in their sample-based estimates.
Why is standard error always positive?
The standard error is always positive because it represents a measure of variability or dispersion. It is calculated by taking the square root of the variance or the mean squared error. Since variance and mean squared error are non-negative values, their square root, the standard error, will always be positive.
Recommended Articles
This article is a guide to what is Standard Error. Here we explain it with a formula, steps on how to find it, examples, interpretation & vs standard deviation. You can learn more from the following articles:-