
Table Of Contents
Formula to Calculate Population Variance
The population variance formula measures the average distances of population data. One may calculate it by finding out the mean of the population formula and variance by the Sum of the square of variables minus the mean that is divided by the number of observations in the population.
Population variance is a measure of the spread of population data. Hence, population variance is the average of the distances from each data point in a particular population to the mean squared. It indicates how data points spread out in the population. Population variance is an important measure of dispersion used in statistics. Statisticians calculate variance to determine how individual numbers in a data set relate to each other.
While calculating population variance, one may calculate the dispersion concerning the population means. Hence, we must find out the population mean to calculate population variance. One of the most popular notifications of the population variance is σ2. It is pronounced as sigma squared.
One can calculate population variance by using the following formula:
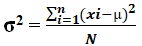
σ2 = ∑ni=1 (xi - μ)2 / N
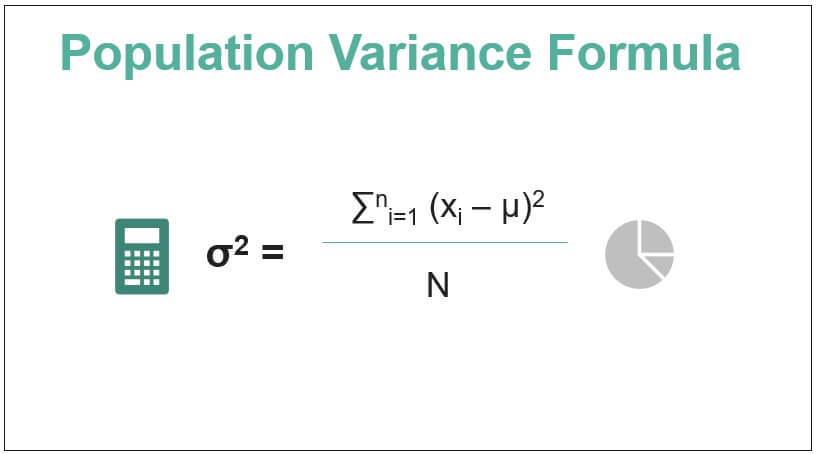
where
- σ2 is population variance,
- x1, x2, x3,…..xn are the observations
- N is the number of observations,
- µ is the mean of the data set
Key Takeaways
- The population variance formula measures the average squared distances of data points from the population mean.
- To calculate it, one can subtract the mean from each data point, square the result, sum all the squared values, and divide by the total number of observations in the population.
- Population variance is a statistical measure that describes the spread or dispersion of data points in a specific population.
- It is an important measure used in statistics to understand the relationships and variations among individual numbers in a dataset.
Step by Step Calculation of Population Variance
One can calculate the formula for population variance by using the following five simple steps:
Step 1: Calculate the mean (µ) of the given data. To calculate the mean, add add all the observations and then divide that by the number of observations (N).
Make a table. Please note that constructing a table is not compulsory, but presenting it in a tabular format would make the calculations easier. For example, in the first column, write each observation (x1, x2, x3,…..xn).
In the second column, write the deviation of each observation from the mean (xi – µ).
In the third column, write the square of each observation from the mean (xi – µ)2. In other words, square each of the numbers obtained in column 2.
Subsequently, we need to add the numbers obtained in the third column. Finally, find the sum of the squared deviations and divide the sum obtained by the number of observations (N). It will help us to obtain
 which is the population variance. This method is commonly followed in Excel to find the variance. However, if you need a quick verification of your result, try variance calculator to get accurate result.
Examples
Example #1
Calculate the population variance from the following 5 observations: 50, 55, 45, 60, 40.
Solution:
Use the following data for the calculation of population variance.
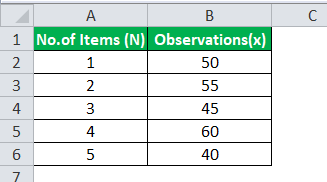
There are a total of 5 observations. Hence, N=5.
µ=(50+55+45+60+40)/5 =250/5 =50
So, the Calculation of population variance σ2 can be done as follows-


σ2 = 250/5
Population Variance σ2 will be-
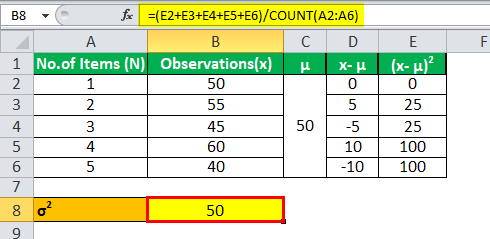
Population Variance (σ2 ) = 50
The population variance is 50.
Example #2
XYZ Ltd. is a small firm and consists of only 6 employees. The CEO believes there should not be high dispersion in the salaries of these employees. For this purpose, he wants you to calculate the variance of these salaries. The salaries of these employees are as under. Calculate the population variance of the salaries for the CEO.
Solution:
Use the following data for the calculation of population variance.
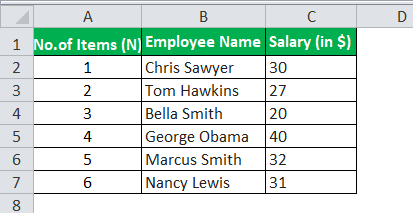
There are a total of 6 observations. Hence, N=6.
=(30+27+20+40+32+31)/6 =180/6 =$ 30
So, the Calculation of population variance σ2 can be done as follows-

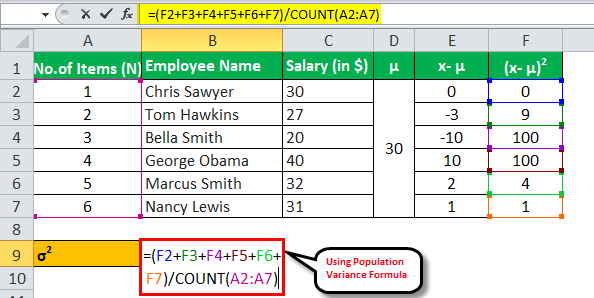
σ2 = 214/6
Population Variance σ2 will be-
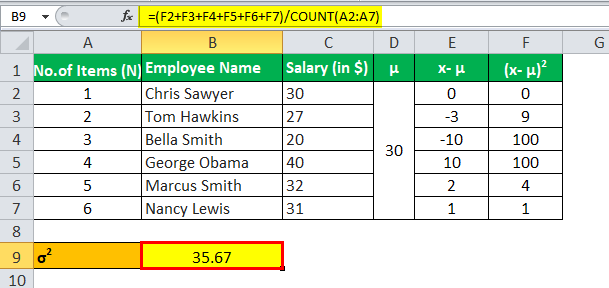
Population Variance (σ2 ) = 35.67
The population variance of the salaries is 35.67.
Example #3
Sweet Juice Ltd. manufactures different flavors of juice. The Management Department purchases 7 big containers for storing this juice in the factory. The Quality Control Department has decided that it will reject the containers if the variance of the containers is above 10. The weights of 7 containers are: 105, 100, 102, 95, 100, 98, and 107. Please advise the Quality Control Department on whether it should reject the containers.
Solution:
Use the following data for the calculation of population variance.
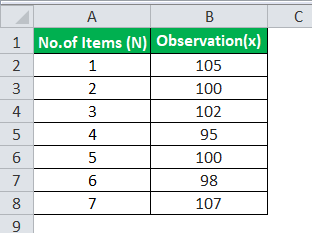
There are a total of 7 observations. Hence, N=7
=(105+100+102+95+100+98+107)/7 =707/7 =101
So, the Calculation of population variance σ2 can be done as follows-
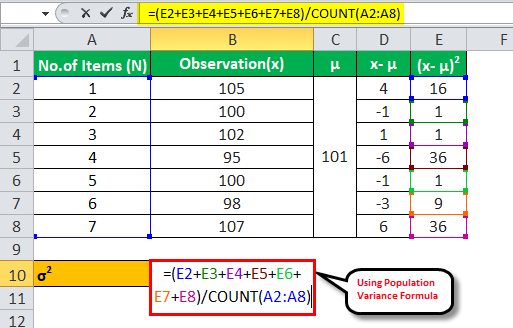
σ2 = 100/7
Population Variance σ2 will be-
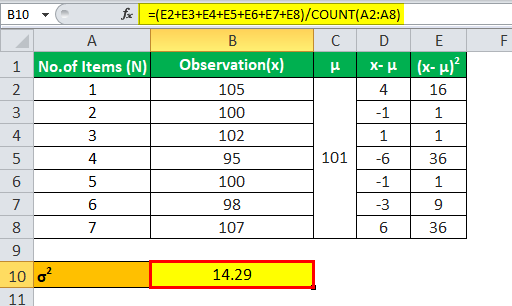
Population Variance (σ2 )= 14.29
Since the variance (14.29) is more than the limit of 10 decided by the Quality Control Department, they should reject the containers.
Example #4
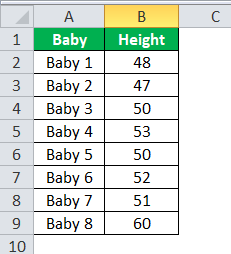
The management team of a hospital named Sagar Healthcare recorded that 8 babies had been born in the first week of March 2019. The doctor wanted to evaluate the health of the babies as well as the variance of the heights. The heights of these babies are as follows: 48 cm, 47 cm, 50 cm, 53 cm, 50 cm, 52 cm, 51 cm, and 60 cm. Calculate the variance of the heights of these 8 babies.
Solution:
Use the following data for the calculation of population variance.
So, the Calculation of population variance σ2 can be done as follows-
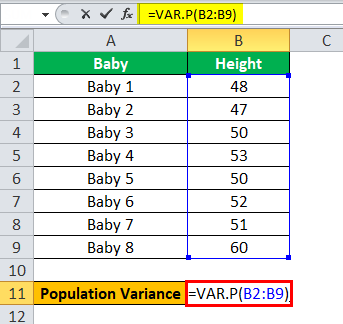
In Excel, there is an inbuilt formula for population variance that one can use to calculate the population variance of a group of numbers. Select a blank cell and type this formula =VAR.P(B2: B9). Here, B2: B9 is the range of cells you want to calculate the population variance from.
Population Variance σ2 will be-
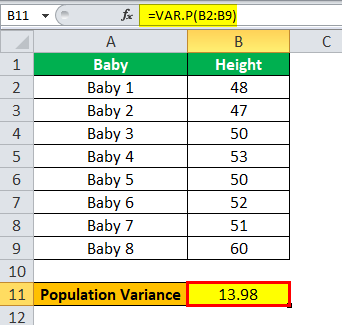
Population Variance (σ2 ) = 13.98
Relevance and Use
One may use the population variance as a measure of dispersion. Let us consider two population sets with the same mean and number of observations. Data set 1 consists of 5 numbers – 55, 50, 45, 50, and 50. Data set 2 consists of 10, 50, 85, 90, and 15. Both the data sets have the same mean, which is 50. But, in data set 1, the values are close to each other, while data set 2 has dispersed values. The variance gives a scientific measure of this closeness/dispersion. Data set 1 has a variance of only 10, while data set 2 has a huge variance of 1130. Thus, a large variance indicates that the numbers are far from the mean and each other. A small variance indicates that the numbers are close to each other.
Variance is used in portfolio management while carrying out asset allocation. Investors calculate the variance of asset returns to determine optimal portfolios by optimizing the two major parameters – return and volatility. Volatility, measured by variance, measures a particular financial security risk.
