Standard Deviation Examples
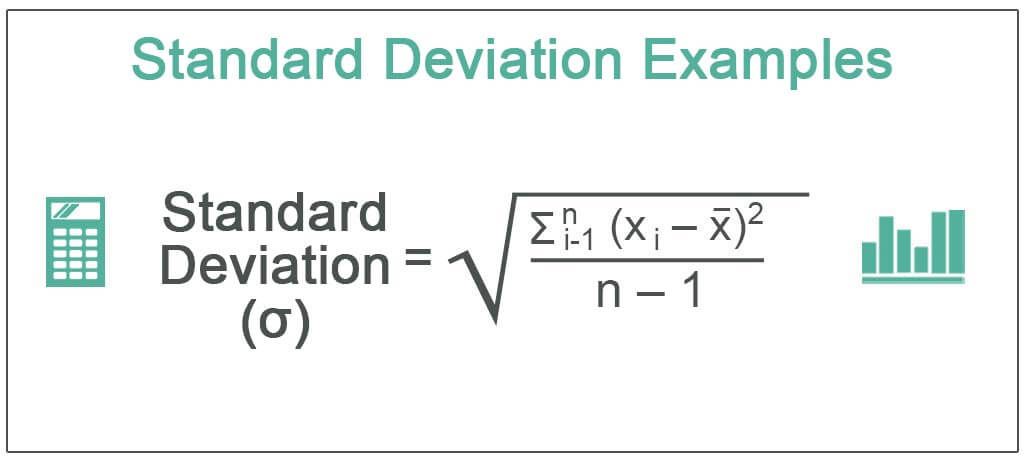
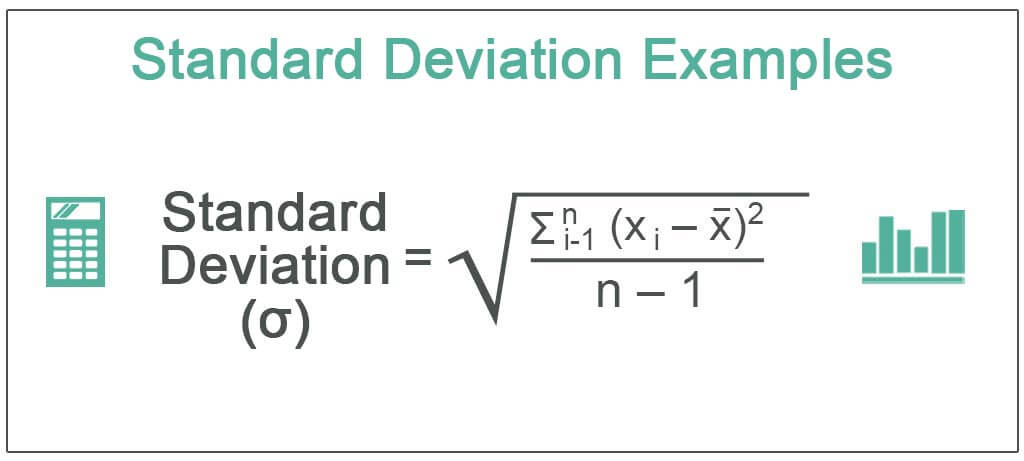
The following standard deviation example outlines the most common deviation scenarios. Standard deviation is the square root of the variance, calculated by determining the variation between the data points relative to their mean. Below is the standard deviation formula.
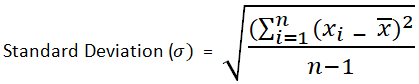
Where,
- xi = Value of the ith point in the data set
- x = The mean value of the data set
- n = The number of data points in the data set
It helps statisticians, scientists, financial analysts, etc., measure a data set’s volatility and performance trends. But first, let’s understand the concept of standard deviation using some examples.
Note:
Remember, there are no good or bad standard deviations; It is just a way to represent data. But generally, a comparison of SD with a similar data set is being made for better interpretation.
Example #1
In the financial sector, the standard deviation is a measure of ‘risk’ used to calculate the volatility between markets, financial securities, commodities, etc. A lower standard deviation means lower risk and vice versa. Also, the risk highly correlates with returns, i.e., with low risk comes lower returns.
E.g., a financial analyst analyzes the returns of Google stock and wants to measure the risks on returns if investments are in a particular stock. Therefore, he collects data on the historical returns of google for the last five years, which are as follows:
| Year | 2018 | 2017 | 2016 | 2015 | 2014 |
| Returns (%) (xi) | 27.70% | 36.10% | 10.50% | 6.80% | -4.60% |
Calculation:
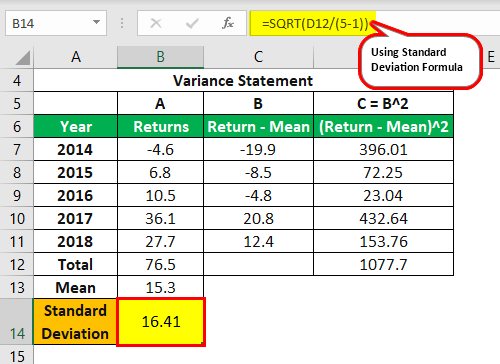
Thus, Google’s stock’s standard deviation (or risk) is 16.41% for annual average returns of 16.5%.
Interpretation
#1 – Comparison Analysis
Let’s say Doodle Inc has similar annual average returns of 16.5% and SD ( σ ) of 8.5%. i.e., with Doodle, you can earn similar yearly returns as with Google but with lesser risks or volatility.
Again let’s say Doodle Inc has annual average returns of 18% and SD ( σ ) 25%. We can surely say that Google is the better investment compared to Doodle because the standard deviation of Doodle is very high compared to the returns it provides. In contrast, Google provides lower returns than Doodle but with very low-risk exposure.
Note:
Investors are risk-averse. They wanted to get compensated for taking higher risks.
#2 – The Empirical Rule
For normal distributions, nearly all (99.7%) of the data falls within three standard deviations of the mean, 95% falls within 2 SD, and 68% falls within 1 SD.
In other words, we can say that 68% returns of Google fall within + 1 time the SD of mean or ( x + 1 σ) = (16.5 + 1 * 16.41) = (0.09 to 32.91%). i.e., 68% returns of an investor of Google can go low to 0.09% and rise to 32.91%.
Example #2
John and his friend Paul argue about the heights of their dogs to properly categorize them as per the rules of a dog show where various dogs will compete with different heights based on categories. John and Paul decided to analyze their dogs’ heights’ variability using the concept of standard deviation.
They have five dogs with all types of heights, so they noted their heights as given below:
The heights of the dogs are 300mm, 430mm, 170mm, 470mm, and 600mm.

Calculation:
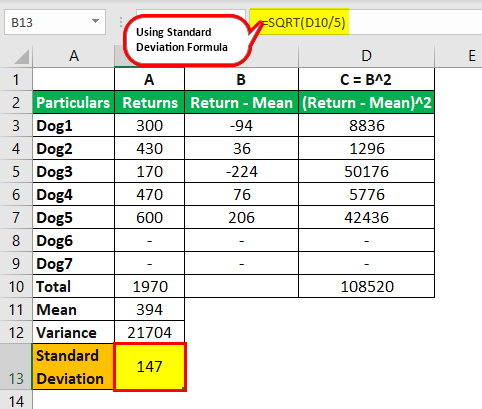
Step 1: Calculate the mean:
Mean ( x ) = 300 + 430 + 170 + 470 + 600 / 5 = 394
The red line in the graph shows the average height of the dogs.
Step 2: Calculate the variance:
Variance ( σ^2 ) = 8836 + 1296 + 50176 + 5776 + 42436 / 5 = 21704
Step 3: Calculate the standard deviation:
Standard Deviation (σ) = √ 21704 = 147
Now, using the empirical method, we can analyze which heights are within one standard deviation of the mean:
The empirical rule says that 68% of heights fall within + 1 time the SD of mean or ( x + 1 σ ) = (394 + 1 * 147) = (247, 541). i.e. 68% of heights fluctuate between 247 and 541.
The theory of the Empirical Method applies only to data-sets that are normally distributed and whose shape appears like a bell curve.
Example #3
Outliers can artificially inflate standard deviation, so identify them and remove them from the better analysis.
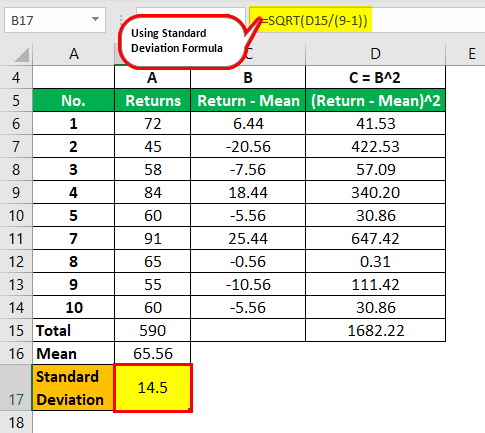
For example, 20 students in a mathematical class grade an average of 60% marks on a practice test. The teacher seems concerned with the poor results, so she calculates the standard deviation of marks to check whether students score far or close to mean marks.
As per the standard deviation calculation, it is 22.26%, which he thinks is very high. So let’s examine the teachers’ concerns.
| Roll no. | 1001 | 1002 | 1003 | 1004 | 1005 | 1006 | 1007 | 1008 | 1009 | 1010 |
| Marks (%) | 72 | 45 | 58 | 84 | 60 | 10 | 91 | 65 | 55 | 60 |
Calculation:
- Using an Empirical concept, he finds 95% of students’ marks fluctuate between ( x + 2 σ ) e.15.5% and 100%. i.e., few students fail in the subject if passing marks are 30%.
- On closely analyzing the marks, he found a very low-scoring student, roll no. 6, who scored only 10%.
- Roll no. 6 is an outlier that disturbs the analysis by artificially inflating the standard deviation and decreasing the overall mean.
- The teacher decides to remove roll no. 6 to re-analyze the performance of the class and found the following result.

Calculation:
- Again, using an empirical concept, he found that 95% of students’ marks fluctuate between 36.50% and 80%. i.e., neither student is failing in the subject.
- However, the teacher has to put extra effort into improving the ‘outlier’ Roll no. 6 because, in real life, a student cannot be removed where a teacher finds hope for improvements.
Key Takeaways
- The standard deviation example illustrates common scenarios of deviation in a dataset.
- Standard deviation is the square root of the variance and measures the variation between data points and their mean.
- It is a valuable tool for statisticians, scientists, financial analysts, and others to assess a dataset’s volatility and performance trends.
- Standard deviation provides insights into the distance of data points from the mean and facilitates the comparison of different datasets with the same average.
Conclusion
Statistics informs how tightly various data points clustered around the mean in a normally distributed data set. For example, if the data points bunches closely near the mean, the standard deviation will be a small figure. As a result, the bell curve will be steeply shaped and vise-versa.
The more popular statistical measures like mean (average) or median may mislead the user due to extreme data points. Still, standard deviation educates the user about how far the data point lies from the mean. Also, it helps compare two different data sets if the averages are the same for both data sets.
Hence, they present a complete picture where basic means can be misleading.
Frequently Asked Questions (FAQs)
What is an example of why standard deviation is important?
An example of why standard deviation is important is in investment portfolios. It helps investors assess the risk associated with different assets. Suppose two portfolios have the same average return but different standard deviations. In that case, the one with a higher standard deviation indicates higher volatility, meaning the returns are more spread out and unpredictable. The standard deviation allows investors to make informed decisions based on risk tolerance.
What is variance vs. standard deviation?
Variance and standard deviation are measures of dispersion in a dataset. Variance calculates the average squared deviation from the mean, while standard deviation is the square root of variance.
Where is the standard deviation used?
Standard deviation is used in various fields. In statistics, it measures the spread of data points from the mean and helps understand the distribution of a dataset. It is also used in finance to assess investment risk. In quality control, standard deviation indicates the variability in manufacturing processes. The standard deviation is also employed in scientific research, such as in analyzing experimental results or studying natural phenomena with varying data points.