Formula to Calculate Skewness
The term “skewness” refers to the statistical metric used to measure the asymmetry of a probability distribution of random variables about its mean. Its value can be positive, negative, or undefined. The skewness equation is calculated based on the mean of the distribution, the number of variables, and the standard deviation of the distribution.
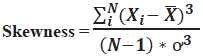
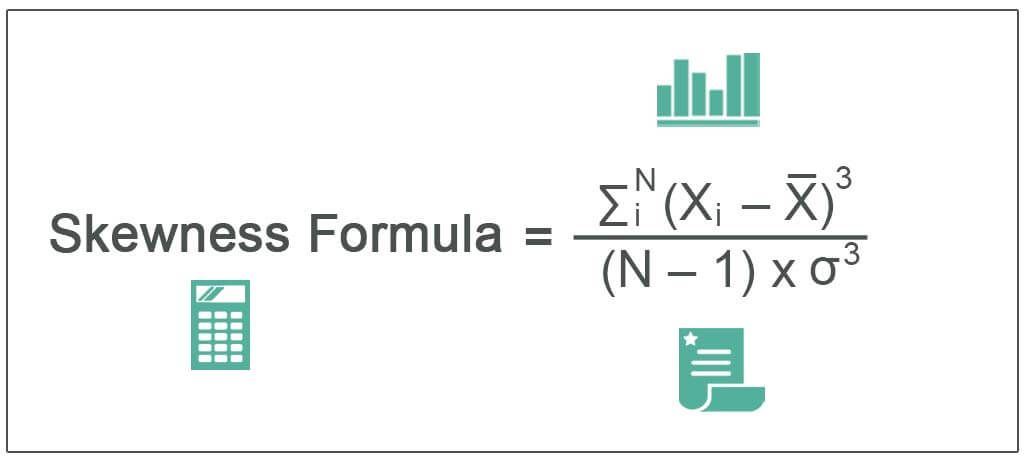
Mathematically, the skewness formula represents,
Skewness = ∑Ni (Xi – X)3 / (N-1) * σ3

where
- Xi = ith Random Variable
- X= Mean of the Distribution
- N = Number of Variables in the Distribution
- Ơ = Standard Distribution
- The skewness formula is statistical and determines the probability distribution of the given variables. In addition, it can be positive, negative, or undefined.
Key Takeaways
- The “skewness” refers to the statistical tool one may use to determine the asymmetry of a probability distribution of random variables about its mean. In addition, it can be positive, negative, or undefined.
- Moreover, one may understand the skewness equation based on the mean of the distribution, the number of variables, and the standard deviation of the distribution.
- One may use skewness to calculate the symmetry of data distribution. It is essential in risk management, portfolio management, trading, and option pricing.
Calculation of Skewness (Step-by-Step)
Follow the below steps.
- Firstly, form a data distribution of random variables, and Xi denotes these variables.
- Next, figure out the number of variables available in the data distribution, denoted by N.
- Next, calculate the mean of the data distribution by dividing the sum of all the random variables of the data distribution by the number of variables in the distribution. The mean of the distribution is denoted by X.

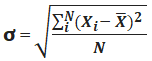
- Next, determine the standard deviation of the distribution by using the deviations of each variable from the mean, i.e., Xi– X , and the number of variables in the distribution. Finally, the standard deviation is calculated, as shown below.

- Finally, the calculation ofskewnessis done based on the deviations of each variable from the mean, several variables, and the standard deviation of the distribution, as shown below.


Example
Let us take the example of a summer camp in which 20 students assign certain jobs that they performed to earn money to raise funds for a school picnic. However, different students earned different amounts of money. Based on the information given below, determine the skewness in the income distribution among the students during the summer camp.
Solution:
The following is the data for the calculation of skewness.
Number of variables, n = 2 + 3 + 5 + 6 + 4= 20
Let us calculate the midpoint of each of the intervals.
- ($0 + $50) / 2 = $25
- ($50 + $100) / 2 = $75
- ($100 + $150) / 2 = $125
- ($150 + $200) / 2 = $175
- ($200 + $250) / 2 = $225
Now, one can calculate the mean of the distribution as,


Mean= ($25 * 2 + $75 * 3 + $125 * 5 + $175 * 6 + $225 * 4) / 20
Mean = $142.50
One can calculate the squares of the deviations of each variable as below,
- ($25 – $142.5)2 = 13806.25
- ($75 – $142.5)2 = 4556.25
- ($125 – $142.5)2 = 306.25
- ($175 – $142.5)2 = 1056.25
- ($225 – $142.5)2 = 6806.25
Now, one can calculate the standard deviation by using the below formula,
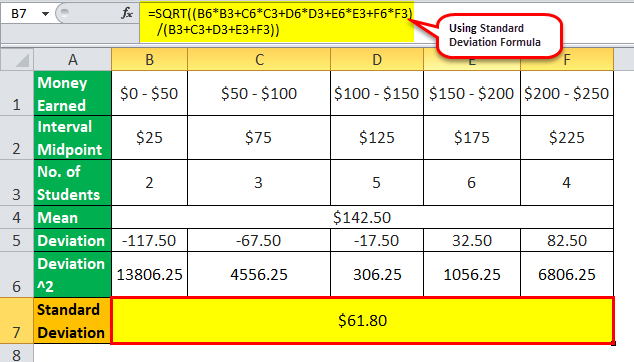
ơ = [(13806.25 * 2 + 4556.25 * 3 + 306.25 * 5 + 1056.25 * 6 + 6806.25 * 4) / 20]1/2
ơ = 61.80
One can calculate the cubes of the deviations of each variable below,
- ($25 – $142.5)3 = -1622234.4
- ($75 – $142.5)3 = -307546.9
- ($125 – $142.5)3 = -5359.4
- ($175 – $142.5)3 = 34328.1
- ($225 – $142.5)3 = 561515.6
Therefore, the calculation of the skewness of the distribution will be as follows,


= (-1622234.4 * 2 + -307546.9 * 3 + -5359.4 * 5 + 34328.1 * 6 + 561515.6 * 4) /[ (20 – 1) * (61.80)3]
Skewness will be –

Skewness = -0.39
Therefore, the skewness of the distribution is -0.39, which indicates that the data distribution is approximately symmetrical.
Relevance and Uses of Skewness Formula
As this article shows, one may use skewness to describe or estimate the symmetry of data distribution. It is crucial in risk management, portfolio management, trading, and option pricing. The measure is known as “Skewness” because the plotted graph gives a skewed display. A positive skew indicates that the extreme variables are larger than the skews. The data distribution is such a way it escalates the mean value in a way that it will be larger than the median resulting in a skewed data set. On the other hand, a negative skew indicates that the extreme variables are smaller, bringing down the mean value and resulting in a median larger than the mean. So, skewness ascertains the lack of symmetry or the extent of asymmetry.
Frequently Asked Questions (FAQs)
What is the skewness formula in Excel?
he SKEW function syntax in Excel is SKEW(x). It considers a single number input, the number of data points in the dataset. Then, It determines the skew coefficient for the dataset.
What is the coefficient of skewness formula in Excel?
One may calculate Pearson’s coefficient of skewness by multiplying the difference between the mean and median, multiplied by three. Then, the result obtained is divided by the standard deviation. Moreover, one may utilize AVERAGE, MEDIAN, and STDEV. P Excel functions to get a value for the measure.
What is the skewness formula in Python?
One may calculate the skewness formula in Python from scipy. Stats import skew. Python. Then, print(skew(x)) Python and lastly, print(skew(x, bias=False)) Python.
How to determine if the skewness formula is significant?
If the skewness formula is significant, the skewness is between -0.5 and 0.5; then, the data are relatively symmetrical. In addition, one may consider it moderately skewed if the skewness is between -1 and – 0.5 or between 0.5 and 1. Moreover, it is highly skewed if the skewness is less than -1 or greater than 1.
Recommended Articles
This article has been a guide to Skewness Formula. Here, we discuss calculating skewness using its formula with practical examples and a downloadable Excel template. You can learn more about Excel modeling from the following articles: –