Table of Contents
What Is Revenue Analytics?
Revenue analytics encompasses the examination of data to source decisions aimed at revenue generation. It often revolves around data from leads, customers, products/services, and occasionally operations. It entails delving into a company's sales data to extract insights that can enhance revenue streams by identifying patterns.
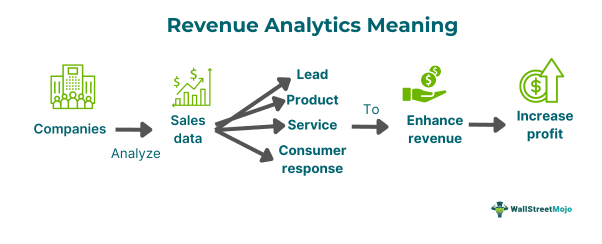
The analytics supports businesses in making profitable decisions to improve financial outcomes. It assists in determining optimal product pricing, acquiring new customers, segmenting customers effectively, and managing finances efficiently. By analyzing data, it uncovers insights into revenue generation, predicts customer behavior, allocates resources wisely, and identifies avenues for revenue growth.
Key Takeaways
- Revenue analytics is the act of examining data to make revenue-related decisions. It also helps to anticipate customer actions, optimize resource allocation, and identify opportunities for increasing revenue.
- The process involves standardizing data, selecting analytics tools, and sharing insights with stakeholders.
- Benefits include enhanced customer understanding, identification of sales opportunities, improved revenue forecasting, optimized recurring revenue, and establishment of revenue goals.
- In B2B, customer segmentation focuses on key clients, prioritizing product quality and pricing optimization.
- At the same time, B2C emphasizes tailored marketing, impactful campaigns, and engaging customer experiences, often using discounts and promotions to stimulate sales.
Revenue Analytics Explained
Revenue analytics is the act of analyzing data to make revenue-related decisions. It covers areas like leads, customers, products/services, and sometimes operations. It encompasses the collection and analysis of relevant data to unveil patterns, trends, and valuable insights crucial for strategic decision-making. This data encompasses historical sales records, pricing information, market dynamics, customer details, and external variables influencing revenue.
Founders and executives must understand sales sources, ideal customer personas, pricing, and customer acquisition. Analyzing data from various standpoints helps achieve insights into these factors. These data points collectively contribute to a revenue generation strategy known as revenue analytics, with specifics varying depending on whether a company sells to businesses or end-users. Typically, the analytics begins with analyzing historical data to uncover patterns and trends.
The main objectives involve understanding revenue drivers, amplifying successful strategies, addressing issues, refining forecasting, and exploring new revenue avenues. Access to extensive sales and customer data drawn from various sources and marketing platforms is crucial. Statistical techniques and mathematical modeling are also employed to identify trends and make predictions. They are presented through reports and dashboards for actionable insights. These analytics optimize sales performance, boost profits, and enhance overall revenue management. Additionally, they improve the transparency of operations and data-driven thinking. This makes it essential for informed decision-making across sales, finance, and marketing teams.
Process Steps
Given below are three major steps for delving into revenue analytics:
Step 1: Data Standardization
Businesses can begin by defining the timeframe for revenue analysis and gathering relevant data from various sources such as accounting, marketing, email, supply chain, and social media. Ensuring consistency and relevance is vital, particularly when dealing with diverse data origins.
Step 2: Tool Selection and Analysis Initiation
Businesses need to choose a suitable revenue analytics tool, whether it's Microsoft Excel or specialized software, to interpret the collected data. The objective is to assess the performance of the business's sales revenue within the specified timeframe and identify actionable insights.
Step 3: Sharing Insights with Stakeholders
Communicate the findings with relevant stakeholders, utilizing graphs and visuals to enhance comprehension. Present the information in a manner that is both actionable and easily understandable to facilitate decision-making.
Examples
Let us look into some examples to understand the concept of revenue analysis better.
Example #1
Suppose Howard runs a small grocery store that was started by his father two decades ago. Howard's store has a huge customer base and daily footfall. Every day, Howard does business for thousands of dollars. He only maintains a savings account and makes weekly deposits in the local bank. Though Howard has a reasonable income, he never indulges in facilities like credit cards, digital banking, mobile applications, loans, and other facilities that come with his bank account.
Every time Howard wants to buy something, he pays through cash and is never interested in taking short-term loans or paying through credit cards. This is a simple example. Howard does have a simple savings account, but apart from the general deposits and withdrawals, he opts to remain like that. In the real world, banks encourage their customers to use more and more banking services.
Example #2
Talking about YouTube revenue analytics. When delving into YouTube analytics to measure channel performance and revenue potential, understanding key metrics like views, ad impressions, and estimated monetized playbacks is essential. Views refer to the number of times a YouTube video has been watched, while ad impressions track the viewership of individual ads within videos. Estimated monetized playbacks indicate how often videos are watched with accompanying ads, giving insight into potential revenue streams.
However, comprehending ad revenue analytics goes beyond surface-level metrics. Dive deeper into YouTube Analytics to assess channel financial health, with Revenue Per Mille (RPM) serving as a crucial indicator. RPM measures the revenue earned per 1,000 video views, offering insights into channel monetization across various sources, including ads, channel memberships, YouTube Premium, Super Chat, and Super Stickers. Understanding RPM empowers creators to optimize revenue strategies and enhance channel financial performance effectively. The creator, as usual, shall look into the factors deeply to get the estimates of YouTube revenue analytics.
Benefits
Given below are some of the benefits of the analysis of revenue:
- Enhanced Customer Understanding: Revenue analysis enables organizations to gain deep insights into customer behavior, including preferences, spending habits, and responses to products and services. By analyzing past sales data, organizations can accurately forecast future demand, optimize resources, and make high-return investments.
- Identification of Sales Opportunities: Through the analysis, companies can identify new sales prospects by uncovering unexplored market segments or revenue streams. Analytics tools also help recognize seasonal sales trends, facilitate strategic planning for peak seasons, and maximize revenue opportunities.
- Improved Revenue Forecasting: Utilizing analytics enhances revenue forecasting accuracy by providing detailed data points such as customer segment performance, product profitability, and sales cycle trends. This clarity enables proactive decision-making, effective anticipating of market changes, and optimization of resource allocation.
- Optimization of Recurring Revenue: The analytics assists businesses in refining recurring income plans by understanding average lengths and potential. This insight guides pricing optimization and proactive measures to improve customer retention by understanding churn rates, thus ensuring consistent and sustainable revenue streams.
- Establishment of Revenue Goals: By leveraging the analysis of revenue, businesses can set realistic targets and goals for budgeting and expansion. Informed decision-making based on revenue insights ensures competitiveness and maximizes profits, helping companies stay ahead of the competition while achieving long-term financial objectives.
Revenue Analytics in B2B Vs. B2C
Differences between both the concepts are given as follows:
Customer Segmentation
- B2B: In B2B settings, customer segmentation centers on identifying key clients and evaluating their long-term value to the organization.
- B2C: For B2C enterprises, customer segmentation entails understanding individual preferences and behaviors to tailor marketing strategies effectively.
Approach
- B2B: B2B organizations prioritize the quality of products or services, recognizing that superior offerings can attract and retain the business's loyal customers who are willing to pay premium prices.
- B2C: While product quality remains important in B2C, revenue growth is driven more by marketing strategies, impactful campaigns, and engaging customer experiences.
Pricing
- B2B: Pricing optimization is critical for B2B firms, given their customers' sensitivity to pricing. They aim to maximize revenue while remaining competitive.
- B2C: B2C companies often utilize marketing tactics such as discounts and promotions to stimulate sales and revenue growth rather than focusing solely on pricing optimization.