Part of our Revenue Recognition guide
What Is Sales Revenue?
Sales Revenue is the income any business entity generates by selling its goods or providing its services during the normal course of its operations. It is reported annually, quarterly or monthly as the case may be in the business entity’s Income statement / Profit & Loss Account.
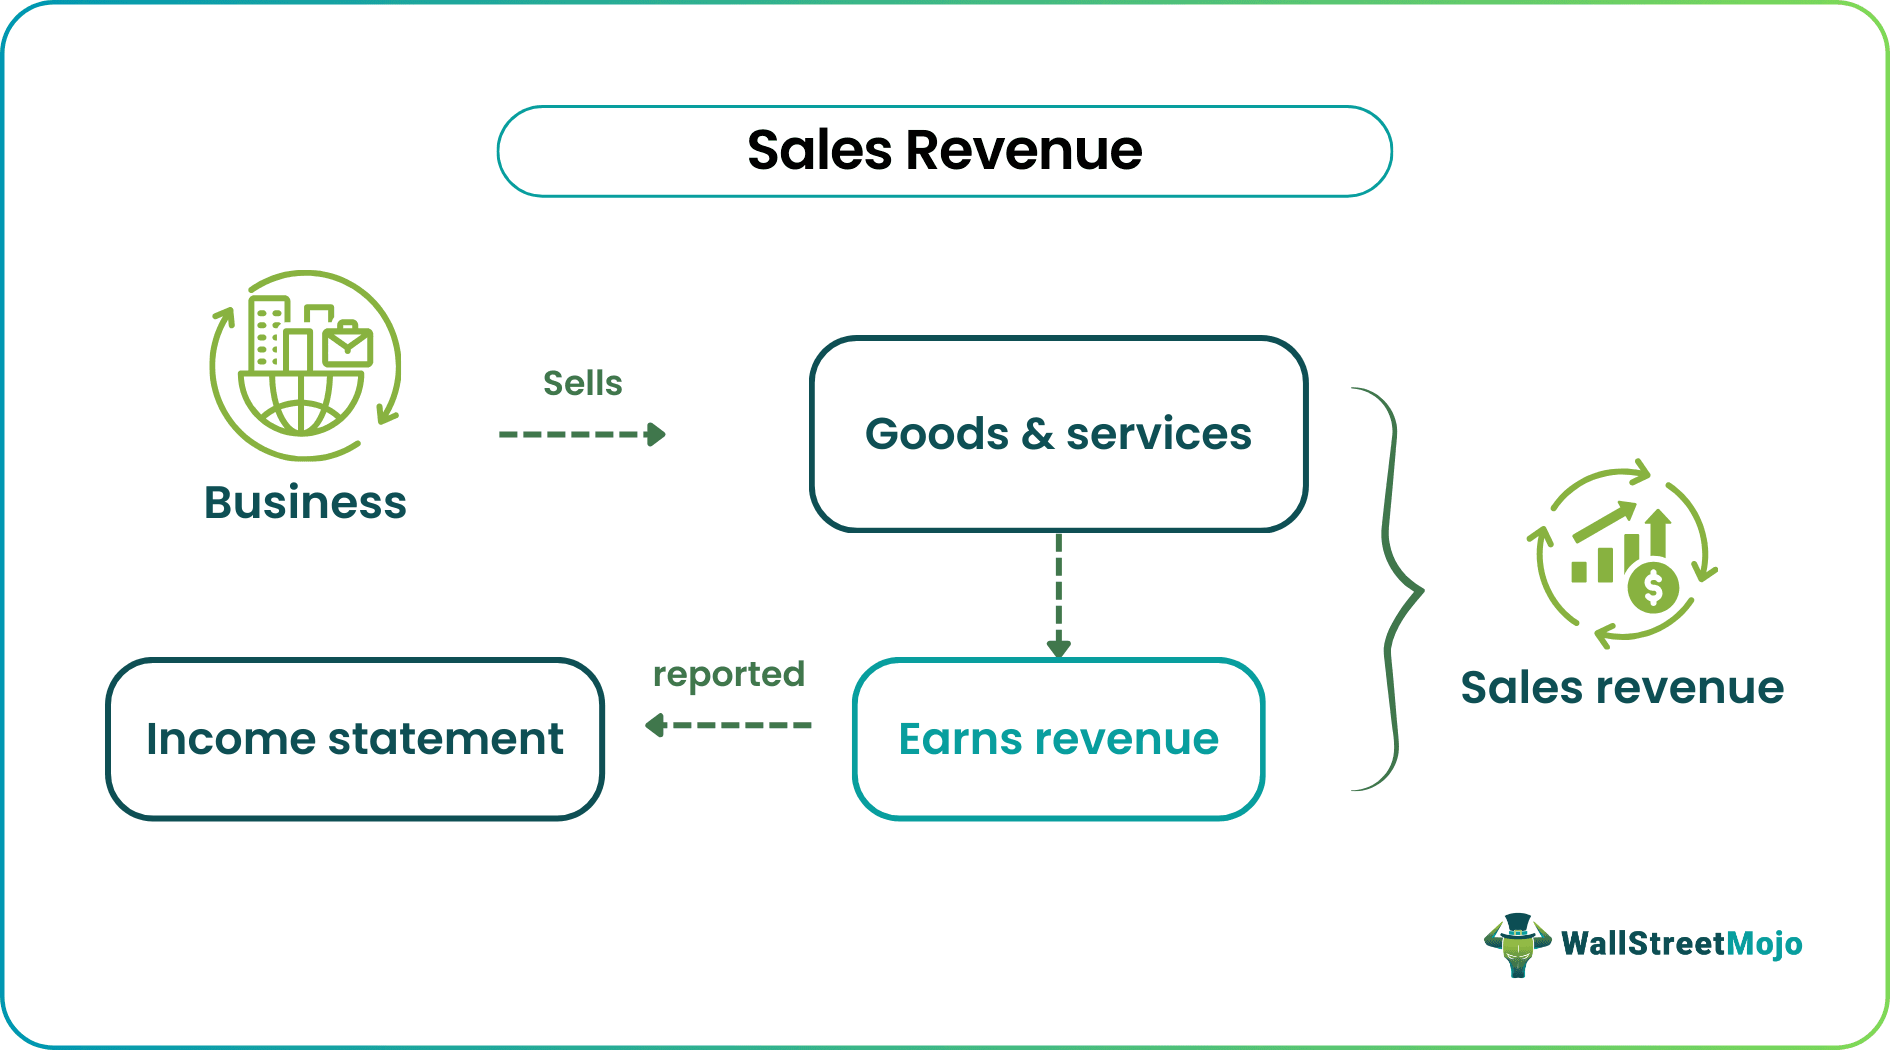
It is the very first line item available in the income statement. In the case of manufacturing companies, it is a calculation by multiplying the number of units sold or produced by the average sales price per unit of that item. It is the foundation of a growing and successful entity and so it should always strive to increase revenue through higher deal conversion.
- Every company’s sales revenue is the money it makes by offering its products or services to customers normally throughout the business.
- It is included in the income statement or profit & loss account of the business entity, depending on whether it is reported yearly, quarterly, or monthly. It is the very first line item in the income statement that is available.
- The sales revenue is calculated by multiplying the units sold by the selling price. In the case of a service-based company, the sales revenue is the total revenue earned against the services provided by the company.
- Profitability alone does not capture meaningful information about the firm that may be obtained via sales measurement. One may get the most out of company information by appreciating the significance of revenue measurement.
Sales Revenue Explained
Sales revenue is the income that any business entity can earn after selling its goods and services. It is recognized in the income statement. It is the foundation of any financial analysis of the current position, forecasting the future performance and planning for further development and expansion.
However, it is important to note that the revenue booked does not necessarily mean the entire revenue from sales has been received in cash. A certain portion of this revenue may be paid in cash, while the remaining portion may be purchased on credit through terms such as accounts receivable.
Furthermore, the total sales revenue can be broken down into gross and net revenue. Gross sales include all receipts and billings realized from the sale of goods or services but do not deduct any sales returns and allowances. On the other hand, net sales deduct all sales returns and allowances from gross sales. Therefore, it is essential for every entity to analyze its financial condition and find out ways how to increase sales revenue.
Formula
The formula for calculating the same is as follows:
Sales Revenue formula= Number of Units Sold * Average Sales Price per Unit
For serviced-based companies, revenue is expressed as a product of the number of customers served an average price of service, which is represented as,
Sales Revenue formula = Number of Customers Served * Average Price of Service.
Thus, it is important for every business to concentrate on sales revenue maximisation.
How To Calculate?
The steps in the determination of total sales revenue from sales (gross revenue for a manufacturing unit) are the following three steps:
Firstly, let us determine the number of units manufactured and sold during a specific period, say annually.
Now, since the number of units produced is driven by demand, which forms the basis of the function for the price, let us assess the average sales price per unit.
Finally, the revenue is calculated by multiplying the number of units sold (step 1) and the average sales price per unit (step 2).
The above steps not only help in identifying the revenue but also plan for sales revenue maximisation for future purpose.
Journal Entry
→ Explore all 30 Journal Entries articles
Let us look at the entry for the sales revenue on income statement.
Case #1
Cash Sale – Cash/ Bank Account Debit
To Sales Account
Case#2
Credit Sale – Debtor / Accounts Receivable Account Debit
To Sales Account
Examples
Let us look at some examples to understand the concept.
Example #1
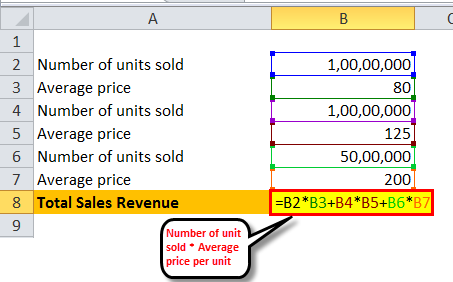
Let us consider the example of a tire manufacturer, which produced 25 million tires across different vehicle segments in 20XX. Throughout the year, the company sold 10 million tires at an average price of $80, 10 million tires at an average price of $125, and 5 million tires at an average price of $200 across different vehicle segments. Determine the revenue for the company.
Sales = number of units sold * Average sales price per unit
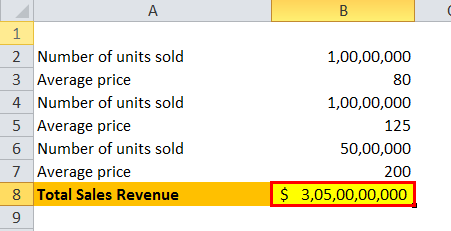
- Total Revenue = $3,050,000,000 or $3.05 billion
Example #2
Let us assume that there is a mobile manufacturing company in which the monthly sales volume has increased from 1,500 to 6,500 during the 12 months ending in November 2018. Then, the price function during each month is governed by the function (7000 – x), where ‘x’ is the number of mobiles sold during the month.
Please note that during March 2018, the mobile sales volume stood at 2,900. Therefore, calculate sales in March 2018 and November 2018.
Based on the available information, the monthly revenue from sales can be calculated as below.
- Monthly sales = x * (7000 – x)
- Monthly sales = 7000x – x2
The mobile sales stood at 2,900 units during March 2018, then the total monthly sales in March 2018 can be calculated as,
- Monthly revenue March 2018 = 7,000 * 2,900 – (2,900)2
- Monthly revenue March 2018 = $11,890,000 or $11.89 million
Again the mobile sales went up to 6,500 units during November 2018, then the monthly sales in November 2018 can be calculated as,
- Monthly revenue November 2018 = 7,000 * 6,500 – (6,500)2
- Monthly revenue November 2018 = $3,250,000 or $3.25 million
Relevance And Uses
Although profit might be the major focus of the smaller business entities, another financial term is just as important. The measurement of sales can provide actionable information about the business, which is not captured by profitability alone. One can extract the maximum benefits from the business information by recognizing the importance of revenue measurement.
It helps in examining trends in sales revenue on income statement over some time, which enables the business owners to understand their business much better. Some of the benefits of tracking the revenue are like analysis of daily sales trends to understand if there is any particular pattern in customer behavior. Further, a business owner can observe the monthly revenue from sales trends to establish a relationship between sales volume and seasonality. Finally, based on this revenue trend, the management can make certain decisions to boost production or support the sales price per unit by managing the sales volume according to the customer profile, seasonality, etc. This will help to understand how to increase sales revenue for the business.
Sales Revenue Vs Net Sales Vs Cash Flow
Sales revenue is the amount of the total sales made whereas net sales is the total revenue minus the discounts and allowances. Cash flow is the amount of cash going in and out of business. However, let us look at the differences between them.
| Sales Revenue | Net Sales | Cash Flow |
|---|---|---|
| It is the amount the business earns after selling the goods. | It is the sales amount minus the discounts, returns and allowances. | It is the amount of cash moving in and out of business. |
| It is the total revenue. | It is a part of sales revenue. | It is the part of revenue actually received in cash. |
| It is the top line of the income statement. | It is the sales after deducting the expenses. | It is reflected in the cash flow statement. |
Frequently Asked Questions (FAQs)
How is sales revenue calculated?
Multiplying the number of units sold by the selling price yields the sales revenue. The entire money made from the services the firm provides is what is referred to as the sales revenue in the case of a service-based business.
Why is sales revenue calculated?
Sales revenue determines a business’s revenue in a specific period. It calculates all major indicators such as EBITDA, EBIT, Operating profit, Profit after Tax, etc.
Is sales revenue and total revenue the same?
Sales revenue is a business’s total revenue through its operating activities. Total revenue, however, includes all types of revenue, i.e., operating, financing, and investing revenue.
Recommended Articles
This article has been a guide to what is Sales Revenue. We explain its formula, how to calculate with examples, journal entry & difference with net sales & cash flow. You can learn more about financial analysis from the following articles –