Difference Between Equity and Enterprise Value
The difference between equity and enterprise value can be cited with respect to whom they are made available to. The equity value of the company is of two types: market equity value which is the total number of shares multiplied by the market share price, and the book equity, which is the value of assets minus liabilities; whereas enterprise value is the total value of equity plus debt minus the total amount of cash the company has – this roughly gives an idea about total obligation a company has.
This is one of the most common valuation topics that confuse equity research and investment banking. In most basic terms, equity value is the value only to the shareholders; however, Enterprise value is the firm’s value that accrues to both the shareholders and the debt holders (combined).
Equity vs Enterprise Value Comparative Table
Equity Value
- Express the value of shareholders’ claims on the assets and cash flows of the business
- Reflects residual earnings after the payment to creditors, minority shareholders & other non-equity claimants
- Advantages of Equity Value
- More relevant to equity valuations
- More reliable
- More familiar to investors
Enterprise Value (EV)
- Cost of buying the right to the whole of an enterprise’s core cash flow
- Includes all forms of capital – equity, debt, preferred stock, minority interest
- Advantages of Enterprise Value
- Accounting policy differences can be minimized
- Avoid the influence of capital structure
- Comprehensive
- Enables to exclude non-core assets
- Easier to apply to cash flow
Equity Value Video Explanation

What Is Equity Value?
Equity value is simply the value of a firm’s equity, i.e., the firm’s market capitalization. It can be calculated by multiplying the market value per share by the total number of shares outstanding.
For example, let’s assume Company A has the following characteristics:
| Company A | Amount |
|---|---|
| Shares Outstanding | $ 1,000,000 |
| Current Share Price | $ 50.0 |
Based on the formula above, you can calculate Company A’s equity value as follows:
- = $1,000,000 x 50
- = $50,000,000
However, this is not an accurate reflection of a company’s true value in most cases.
What Is Enterprise Value?
Enterprise value considers much more than just the value of a company’s outstanding equity. It tells you how much a business is worth. Enterprise value is the theoretical price an acquirer might pay for another firm. It is useful in comparing firms with different capital structures since the firm’s value is unaffected by its choice of capital structure. To buy a company outright, an acquirer would have to assume the acquired company’s debt, though it would also receive all of the acquired company’s cash. Acquiring the debt increases the cost of buying the company, but acquiring the cash reduces the company’s cost.
- Enterprise Value = Market value of operating assets
- Equity Value = Market value of shareholders’ equity
Net Debt – Net debt equals total debt, less cash, and cash equivalents.
- When calculating total debt, include both the long-term debt and the current portion of long-term debt or short-term debt. Any in-the-money (ITM) convertible debt is treated as if converted to equity and is not considered debt.
- When calculating cash and equivalents, you should include such balance sheet items as Available for Sale Securities and Marketable Securities,
- The market value of debt should be used to calculate enterprise value. However, in practice, you can usually use the book value of the debt.
Let us explain it with an example. Consider the same company A and another company B having the same market capitalization. We assume two scenarios, 1 and 2.
Calculate Enterprise Value for Scenario 1.
| Scenario 1 | Company A | Company B |
|---|---|---|
| Debt | $20.0 | $0.0 |
| Cash | $0.0 | $0.0 |
Enterprise Value for Company A is Market Capitalization ($50 million) + Debt ($20 million) – Cash and Short term investments ($0) = $70 million. EV for Company B is Market Capitalization ($50 million) + Debt ($0) – Cash and Short term investments ($0) = $50 million.
While both companies have the same market capitalization, the better buy is Company B or the company with no debt.
Now, consider scenario 2
| Scenario 2 | Company A | Company B |
|---|---|---|
| Debt | $20.0 | $20.0 |
| Cash | $5.0 | $15.0 |
Calculate Enterprise Value for Scenario 2. EV for Company A is Market Capitalization ($50 million) + Debt ($0) – Cash and Short term investments ($5 million) = $45 million. EV for Company B is Market Capitalization ($50 million) + Debt ($0) – Cash and Short term investments ($15 million) = $35 million.
While both companies have the same market capitalization and no debt, the better deal is Company B, as you would assume $15 million in cash upon purchase of the company.
What Is Equity Value Multiple?
The equity value multiples have the numerator and the denominator as the “Equity” measure. Some of the multiples of Equity value multiples are as per below.

Numerator – Equity Value is the price per share that shareholders are expected to pay for a single share of the company under consideration.
Denominator – Operating parameters like EPS, CFS, BV, etc., equity measures. For example, EPS – Earnings per share, which reflects the profit per share that accrues to the shareholders.
- PE Multiple – This ‘headline’ ratio is, in essence, a payback calculation: it states how many years’ earnings it will take for the investor to recover the price paid for the shares. Other things being equal, when comparing the price of two stocks in the same sector, the investor should prefer the one with the lowest PE.
- PCF Multiple – It measures the market’s expectations of a firm’s future financial health. This measure deals with cash flow; the effects of depreciation and other non-cash factors are removed.
- P/BV Multiple – Useful measure where tangible assets are the source of value generation. Because of its close linkage to return on equity (price to book is PE multiplied by ROE), it is useful to view price to book value together with ROE.
- P/S Multiple – Price/sales can be useful when a company is loss-making or its margins are uncharacteristically low (distressed firms)
- PEG Multiple – PEG ratio is used to determine a stock’s value while considering earnings growth. The enterprise value multiples have the numerator and the denominator as “Pre Debt” and “Pre-Equity” measures. Some of the multiples of Enterprise value multiples are as per below.
What Is Enterprise Value or EV Multiples?
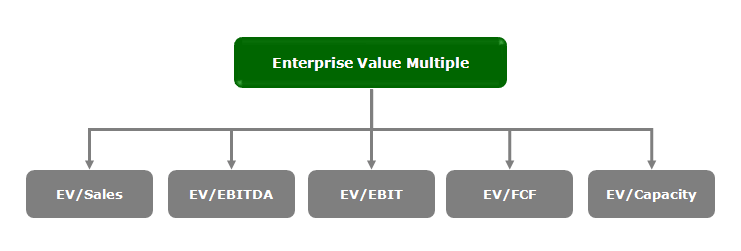
Numerator – Enterprise value is primarily a pre-debt and pre-equity measure as EV reflects values both to the Debtors and Shareholders’.
Denominator – Operating parameters like Sales, EBITDA, EBIT, FCF, and Capacity are pre-debt and pre-equity measures. For example, EBITDA – Earnings “before” Interest tax depreciation and amortization; this implies that EBITDA is the measure before the debtors and shareholders are paid off.
- EV/EBITDA Multiple – Measure that indicates the overall company’s value, not just equity. EV to EBITDA is a measure of the cost of a stock, which is more frequently valid for comparisons across companies than the price to earnings ratio. Like the P/E ratio, the EV / EBITDA ratio measures how expensive a stock is.
- EV/Sales Multiple – EV/sales is a crude measure but is least susceptible to accounting differences. It is equivalent to its equity counterpart, price to sales, where the company has no debt.
- EV/EBIT Multiple – EBIT is a better measure of ‘free’ (post-maintenance capital spending) cash flow than EBITDA and is more comparable where capital intensities differ.
- EV/FCF Multiple – EV/FCF is preferable to EV/EBITDA for comparing companies within a sector. Comparing across sectors or markets where companies have widely varying degrees of capital intensity
- EV/Capacity – Core EV/units of capacity (such as tonnes of cement capacity) or another revenue-generating unit (such as subscribers).
Equity Value vs Enterprise Value – Valuation
There are primarily two ways in which the fair valuation of the company can be arrived at using the relative valuation technique. They are multiple historical methods and sector multiple methods.
#1 – Historical Multiple Method
The common approach compares the current multiple to a historical multiple measured at a comparable point in the business cycle and macroeconomic environment.
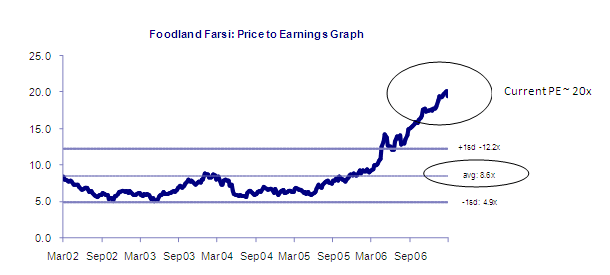
The interpretations are relatively simpler if we create the Price to Earnings Graph. As noted above, Foodland Farsi’s current PE is ~ 20x; however, the historical average PE was closer to 8.6x.
Currently, the market is commanding $20/EPS (defined as PE); however, in the past, this stock was trading at $8.6/EPS. This implies that the stock is overvalued with PE = 20x compared with historical PE = 8.6x, and we may recommend a SELL position on this stock.
#2 – Sector Multiple Method
This approach compares current multiples to those of other companies, a sector, or a market. Below is a hypothetical example to explain this methodology.
| IT Sector | PE |
|---|---|
| HCL Tech | 20.2 |
| TCS | 22.7 |
| Wipro | 25.8 |
| Mahindra Satyam | 21.1 |
| NIIT | 16.0 |
| Patni | 18.3 |
| Sector Mean | 20.7 |
| Infosys | 17.0 |
From the table above, the average PE multiple for the IT sector is 20.7x. However, the company under consideration – Infosys, is trading at 17.0x. This implies that Infosys is trading below the average sector multiple, and a BUY signal is warranted.
Comparable Company Analysis
Below is a typical relative valuation table that an analyst is expected to produce as a part of the research. The comparison table contains the sector companies and their operating and valuation parameters. In most cases, the parameters contained in the table are as below.
- Company Name
- Latest Price
- Market Capitalization
- Enterprise Value
- EBITDA
- Net Income
- Valuation Methodologies like PE, EV/EBITDA, P/CF, etc.;
- Trailing & Forward Multiples are Calculated (2-3 years of multiples)
- Mean & Median Multiple values
The procedure to calculate a multiple can be summarized below.
Though the above example is simple, for applying the same in real-life scenarios, one needs to establish the value and the value driver and make several adjustments.
In my next valuation series, I have discussed the nuts and bolts of Comparable Company Analysis and Sum of Parts valuation.
Equity Value vs Enterprise Value Infographics

Recommended Articles
This article has been a guide to Equity Value vs Enterprise Value. We explain the difference through a comparative table, infographics & comparable company analysis. You may also have a look at the following articles-