Part of our Income Statement guide
Basics of Income Statement
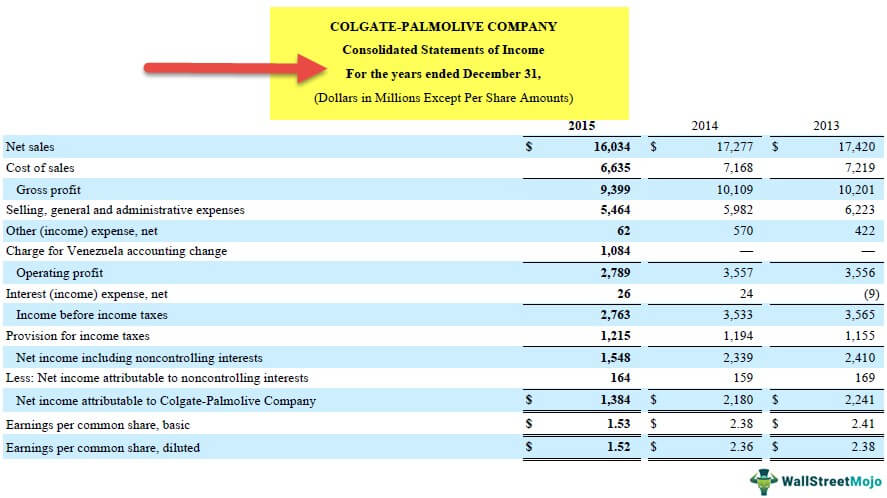
The income statement summarizes the company’s revenues and expenses within a specified period.
- The income statement starts with the company’s revenue from selling products to its customers. Since revenue sits at the top of the income statement, it is the company’s top line.
- Other than the revenue, the income statement consists of all other items that lead to the net income of a company that sits at the bottom. That’s why net income is also a company’s bottom line. All the items are deducted from the company’s revenue to arrive at the net income.
- The line items consist of the cost of goods sold to manufacture those goods. Costs also include selling general & administration expenses.
- The next line item is depreciation, which is also part of the balance sheet.
- Other items deducted to arrive at net income are interest expenses and taxes paid.
The income statement basic equation can be presented as

Basic Example of Income Statement
Let us try to understand the basics of income statement line items with the help of an example.
The income statement equation revenue- expenses= net income for company A is presented in the table below.
The revenue for the company is 50,000. After deducting all the company expenses, including the cost of goods, SG&A, depreciation expense, interest expense, and provision for income taxes, the net income comes up to 500.

Income Statement Video Explanation

Basic Components of Income Statement
We have touched base on the basic components of the income statement in the previous sections. Let us now discuss each item in detail, which makes up a company’s income statement.
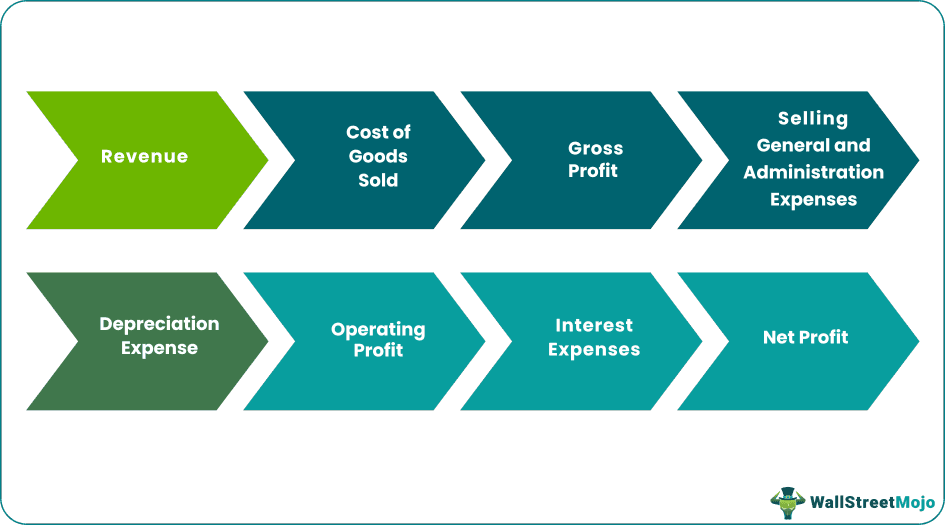
The basic components of the income statement are revenue, cost of goods sold, gross profit, selling general and administrative expenses, earnings before interest tax and depreciation, depreciation expenses, operating profit, interest expenses, taxes, and net profit.
#1 – Revenue
It is the first line item of the income statement, and revenue is calculated by the volume of the product times the selling price. If a company has five segments that sum up to make the total revenue, then the total revenues for individual segments make up the total revenue. Revenue is also known as sales or turnover and is used interchangeably in different countries. Sales is a very crucial figure to look at; for a company to expand, it needs to increase its sales over time and, in a way, capture market share.
We note that Google (Alphabet) makes revenue primarily from three activities – advertising revenues from Google Properties, advertising revenues from Network Members Properties, and Other revenues (including play store, hardware, cloud services, licensing, etc.)

source: Alphabet (Google) SEC Filings
#2 – Cost of Goods Sold
The cost of goods sold is the cost of the raw materials required to manufacture products. These raw materials are sourced from different suppliers, which consists of the bulk of costs required for a company to run a business and expand the business.
Cost of Goods Sold in Google primarily consists of traffic acquisition costs paid to Google Network Members for ads displayed.

source: Alphabet (Google) SEC Filings
#3 – Gross Profit
It is the difference between the revenue of a company and the cost of goods sold for the company.
Gross Profit = Revenues – Cost of Revenues

source: Alphabet (Google) SEC Filings
- Gross Profit (2016) = 90,272 – 35,138 = 55,134 million
- Gross Profit (2015) = 74,989 – 28,164 = 46,825 million
#4 – Selling General and Administration Expenses
This line item consists of all the costs required to manufacture and sell the products. These costs include the cost of factory expenses to marketing expenses. These costs also include personnel costs which are paid to all the employees, whether factory workers or administrative staff and others who get the salary from the company.

source: Alphabet (Google) SEC Filings
- SG&A Expense (2016) = 10485 + 6985 = 17,470 million
- SG&A Expense (2015) = 9047 + 6136 = 15,183 million
#5 – Depreciation Expense
Depreciation is the provision for a company to be able to buy back an asset when it is time for that asset to be scrapped. In the basic income statement, it is the expense for the period. Therefore, depreciation is a non-cash expense for the company.
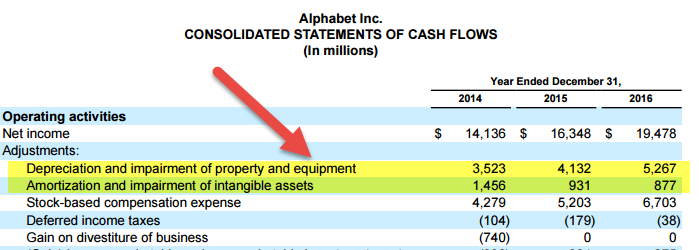
source: Alphabet (Google) SEC Filings
- Google’s Depreciation and Amortization Expense in 2016 was $3,523 and $1,456 million, respectively.
- Google’s Depreciation and Amortization Expense in 2015 was $4,132 and $931 million, respectively.
#6 – Operating Profit
It is arrived at by deducting the selling general and administration expenses and depreciation expenses from the gross profit. This line item is known as the operating profit because the company generates this amount from its operation. Therefore, this income does not include anything generated with financial leverage.
Please note that this Income Statement example of Google includes Research and development costs as an Operating Expense.
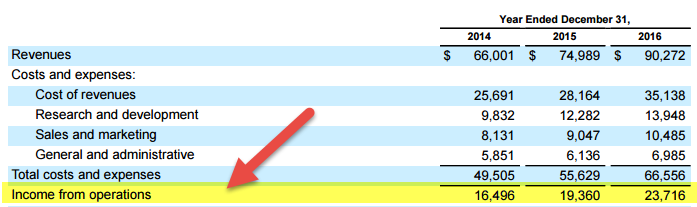
source: Alphabet (Google) SEC Filings
- The operating Profit of Google was $23,716 million in 2016 and $19,360 million in 2015.
#7 – Interest Expenses
These are the interest paid by the company in a particular period for the total debt. It includes interest for short-term debt, long-term debt, and interest payables.
Below is the Income Statement example snapshot: Google’s Interest Income and Interest Expense.
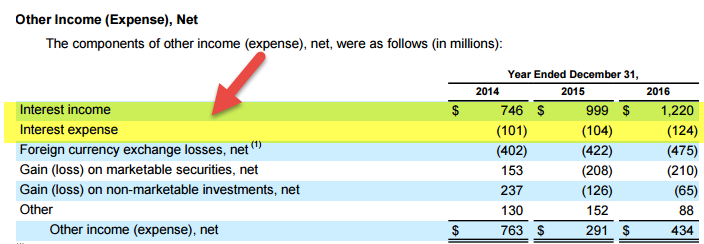
source: Alphabet (Google) SEC Filings
#8 – Net Profit
Net Profit is arrived at by deducting interest expenses and taxes of a company from the operating profit.
Please see the below Net Income calculation from Google’s Income Statement example

source: Alphabet (Google) SEC Filings
- Google’s Net Income was 19,478 million in 2016 and 15,826 million in 2015.
Conclusion
The income statement presents a basic summary of the company’s income and expenses. It is very important to understand each line item to figure out a company’s prospects. The items like sales, net profit, operating profit, and interest expenses are the variables for financial ratios that are tracked to analyze a particular company. In addition, trends need to be tracked for most line items to gauge which way the company is improving and where it is slipping.
Recommended Articles
This article has been a guide to Income Statement Basics. Here we discuss the basic components of the Income Statement (Sales, COGS, SG&A, EBIT, D&A, Interest Expenses, and Net Profit) with the help of practical examples. You can learn more about accounting from the following articles –