What Is Horizontal Analysis?
Based on historical data, a horizontal analysis interprets the change in financial statements over two or more accounting periods. It denotes the percentage change in the same line item of the next accounting period compared to the value of the baseline accounting period.
Horizontal Analysis Formula Excel Template
Download Excel Template- The horizontal analysis examines changes in financial statements over multiple accounting periods, providing insights into trends and comparing line items.
- It calculates the percentage change in specific line items between the current and previous accounting periods.
- Horizontal analysis is useful for financial modeling, forecasting, and identifying trends such as Year over Year (YoY) or Quarter over Quarter (QoQ) changes.
- The horizontal analysis enables predictions of future trends by analyzing consecutive years’ data and comparing each item.
Understanding Horizontal Analysis
The horizontal analysis evaluates trends Year over Year (YoY) or Quarter over Quarter (QoQ). If you are an investor considering investing in a company, only a year-end balance sheet or income statement would not be enough to judge how a company is doing. It would help if you looked at a couple of years to be sure. Better yet, you can see many years of balance sheets and income statements and compare them.
Through horizontal analysis of financial statements, you would be able to see two actual data for consecutive years and would be able to compare every item. And based on that, you can forecast the future and understand the trend.
You do not need special financial skills to ascertain the difference between the previous and last year’s data. However, it would be best if you had diligence, attention to detail, and a logical mind to decipher why the change happens.
In this GKSR example above, we can identify the YoY growth rate using a horizontal income statement analysis. In addition, it helps us identify potential areas of growth and concerns.
For example, in GKSR, we note that the provision for income tax has increased by 12.6%. However, revenues have increased by only 5.5%. Why did provisions increase at a higher rate? Also, there has been a comparatively higher growth of 9.1% in selling and admin costs. What could have contributed to this increase?
As we see, we can correctly identify the trends and develop relevant areas to target for further analysis.
Horizontal Analysis Explained in Video

Horizontal Analysis Formula
First, we need to take the previous year as the base year and the last year as the comparison year. So, for example, let us say we are comparing 2015 and 2016. We will take 2015 as the base year and 2016 as the comparison year.
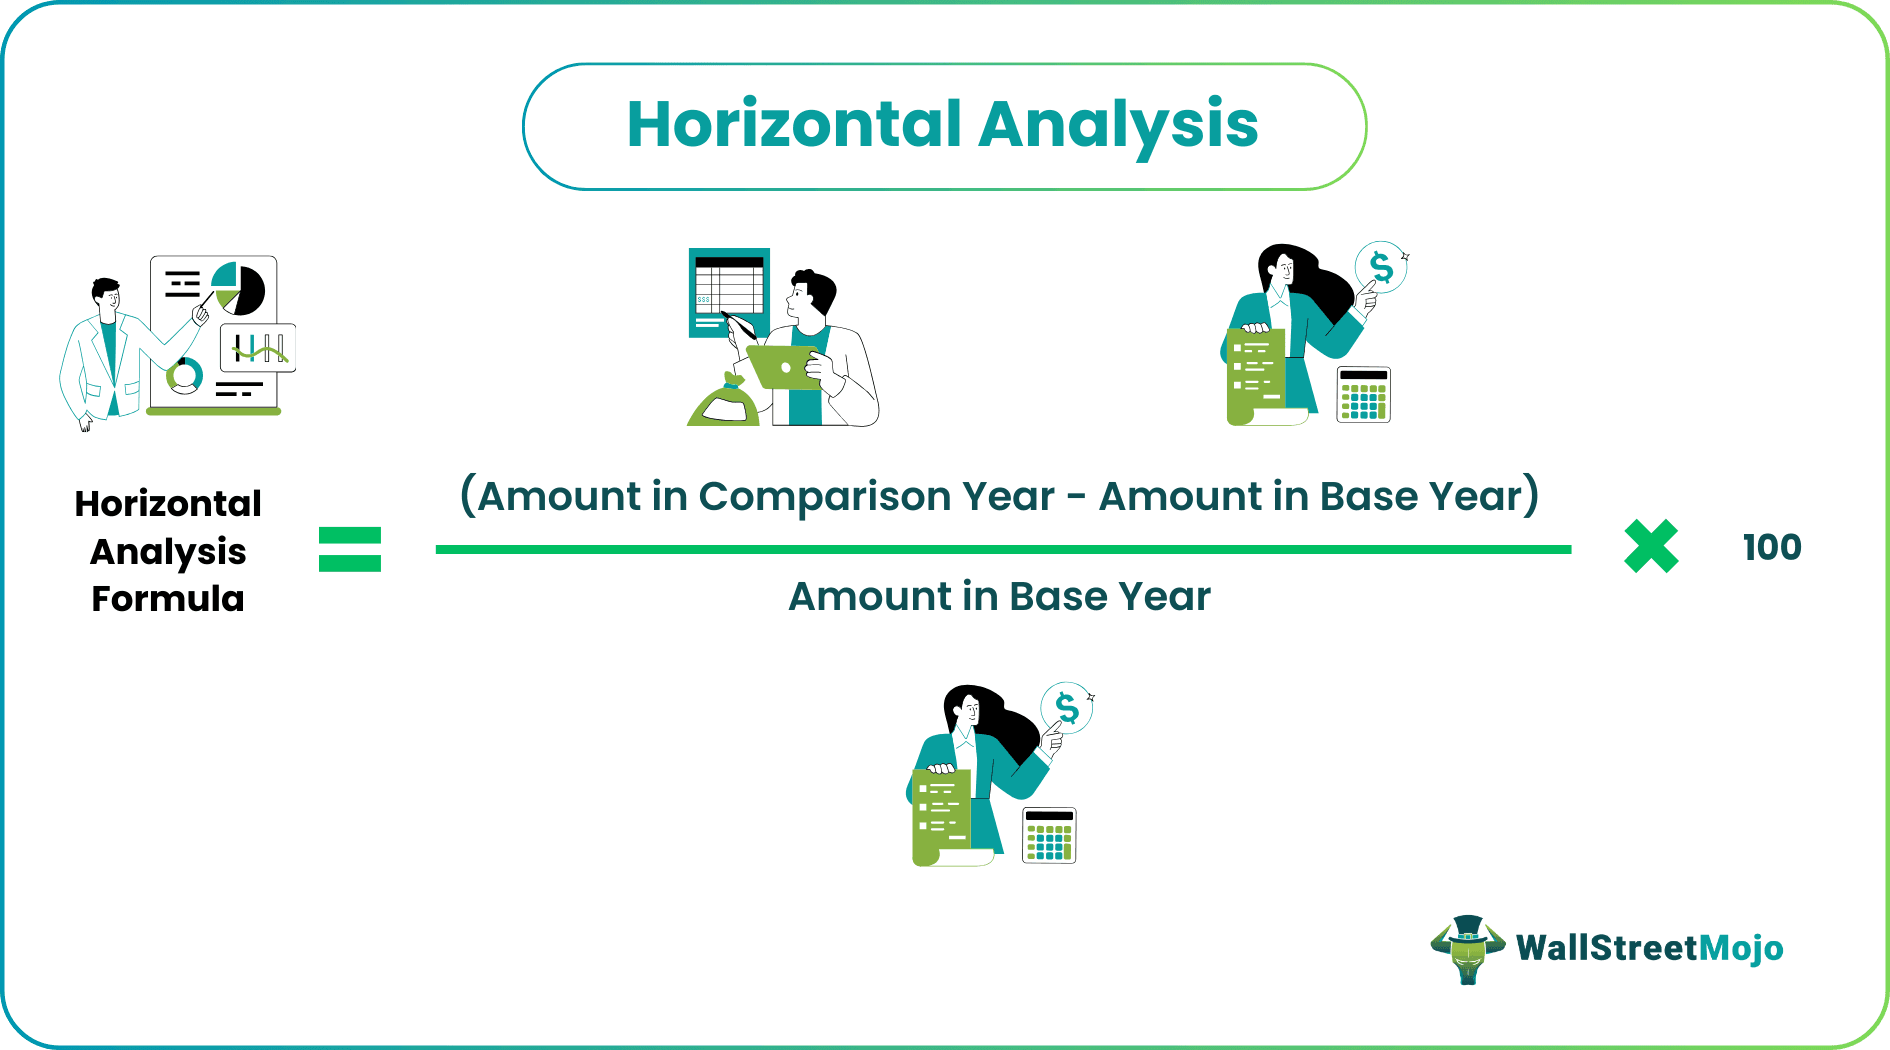
Horizontal Analysis formula = [(Amount in Comparison Year – Amount in the Base Year)/ Amount in a Base Year] x 100

Horizontal Analysis Example
Let us assume that we are provided with the income statement data of ABC Co. We need to perform a horizontal analysis of the income statement of this company.
| Details | 2016 (In US $) | 2015 (In US $) | Amount | Percentage |
|---|---|---|---|---|
| Sales | 30,00,000 | 28,00,000 | 200,000 * | 7.14% ** |
| (-) Cost of Goods Sold(COGS) | (21,00,000) | (20,00,000) | 100,000 | 5% |
| Gross Profit | 900,000 | 800,000 | 100,000 | 12.50% |
| General Expenses | 180,000 | 120,000 | 60,000 | 50% |
| Selling Expenses | 220,000 | 230,000 | (10,000) | (4.35%) |
| Total Operating Expenses | (400,000) | (350,000) | 50,000 | 14.29% |
| Operating Income | 500,000 | 450,000 | 50,000 | 11.11% |
| Interest expenses | (50,000) | (50,000) | § | § |
| Profit before Income Tax | 450,000 | 400,000 | 50,000 | 12.50% |
| Income Tax | (125,000) | (100,000) | 25,000 | 25% |
| Net Income | 325,000 | 300,000 | 25,000 | 8.33% |
The following is a basic example of dividing our approach into two parts. First, we found the absolute difference between the comparative years.
- For example, change in sales = (30,00,000 – 28,00,000) = 200,000
- We find the percentage change = 200,000/28,00,000 * 100 = 7.14%.
Likewise, we can do the same for all the other entries in the income statement.
Colgate Horizontal Analysis
Let us now look at the horizontal analysis of Colgate’s income statement. First, Colgate’s income statement’s YoY growth rates from 2008 until 2015. Then, we calculate the growth rate of each of the line items concerning the previous year.
For example, to find the growth rate of net sales for 2015, the formula is (Net Sales 2015 – Net Sales 2014) / Net Sales 2014.
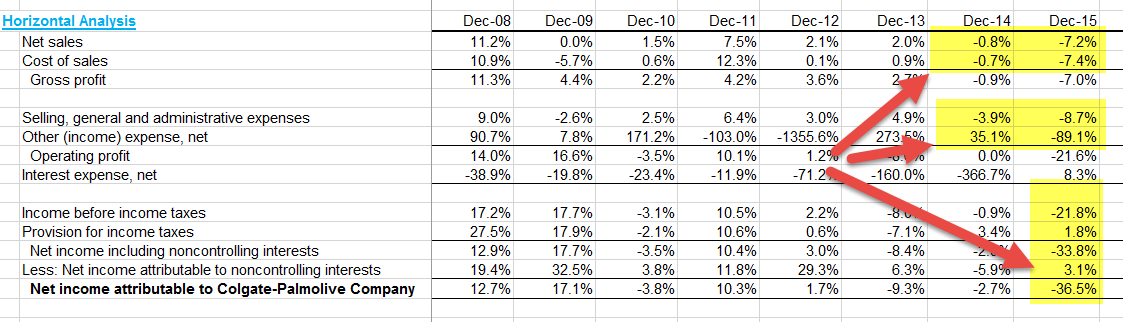
Here are the following observations from Colgate: –
- Colgate has seen a dip in net sales figures in the last two years. In 2015, Colgate saw a de-growth of -7.2%. Why?
- The cost of sales has decreased (positive from the company’s point of view). Why is this so?
- Net income fell in the last three years, with a 36.5% decline in 2015.
Uses in Financial Modeling
Horizontal analysis is very useful for Financial Modeling and Forecasting. The approach used here is pretty simple.
- Step 1 – Perform the horizontal analysis of the income statement and balance sheet historical data.
- Step 2 – You can assume future growth rates based on the YoY or QoQ growth rates.
Let us now look at Colgate 10K 2013 report. First, we noted that Colgate had not provided segmental information in the income statement. However, as additional information, Colgate has provided some details of segments on page 87.
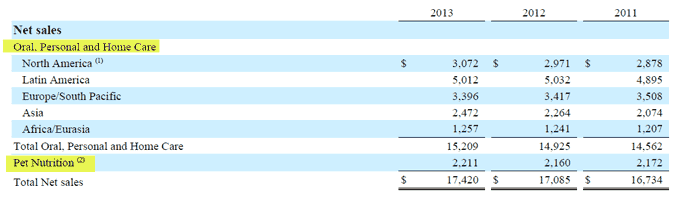 Source – Colgate 2013 – 10K, Page 86
Since we do not have any further information about the segments, we will project the future sales of Colgate based on this available data. We will use the sales growth approach across segments to derive the forecasts. Please see the picture below. We have calculated the Year-over-Year growth rate for each segment.
Now we can assume a sales growth percentage based on the historical trends and project the revenues under each segment. Therefore, total net sales are in the Oral, Personal & Home Care, and Pet Nutrition Segments.
Frequently Asked Questions (FAQs)
1. What are the benefits of horizontal analysis?
Horizontal analysis allows for the comparison of financial data over time, highlighting trends, patterns, and changes in performance. It helps identify growth or decline areas, assess strategies’ effectiveness, and make informed decisions. It enables businesses to track progress, evaluate financial stability, and identify potential risks or opportunities.
2. What are the limitations of horizontal analysis?
The horizontal analysis relies heavily on historical data, which may not accurately reflect future performance. It doesn’t account for external factors or industry changes that may impact financial results. It may overlook qualitative aspects of business performance. Also, horizontal analysis alone may not provide a comprehensive understanding of a company’s financial health and requires additional analysis and context.
3. What is the difference between vertical and horizontal analysis?
The vertical analysis involves comparing financial data within a single period by expressing each line item as a percentage of a base figure, typically sales or revenue. It helps assess the composition and proportion of different components within financial statements. Horizontal analysis, on the other hand, compares financial data across multiple periods to analyze trends, changes, and growth rates. It focuses on identifying patterns and variations in performance over time.
Recommended Articles
This article is a guide to Horizontal Analysis. We discuss the formula of horizontal analysis on the income statement and balance sheet with examples. You may go through the following articles for further readings on financial analysis: –