Table Of Contents
What is the Balance Sheet Analysis?
Balance sheet analysis is the analysis of the assets, liabilities, and owner's capital of the company by the different stakeholders to get the correct financial position of the business at a particular point in time.
The following Balance Sheet Analysis outlines the most commonly used by investors and financial analysts to analyze a company. It is a complete analysis of items on the balance sheet at various intervals of time, like quarterly or annually, and is used by shareholders, investors, and institutions to understand the company’s exact financial position. It is impossible to provide a complete set of analyses that addresses every variation in every situation since there are thousands of variables.
In this article, we have divided our analysis into two parts -
- #1 -Analysis of Assets
- #2 - Analysis of Liabilities

Let us discuss each one of them in detail -
Table of contents
- Balance sheet analysis refers to the company's assets, liabilities, and owner's capital analysis. It is performed by various stakeholders to obtain an accurate financial business position at a specific period.
- It is a comprehensive analysis of the items on the balance sheet at different intervals, such as quarterly or annually.
- Shareholders, investors, and institutions may utilize it to know the company's financial position. Still, it is challenging to enable comprehensive analyses that address every variation in every situation, as there are thousands of variables.
#1 - How to do Analysis of Assets in the Balance Sheet?
Assets include fixed assets or Non-current assets and current assets.
A) Non-Current Asset
Non-current assets include the items of fixed assets like property plant & equipment (PPE). The fixed-assets analyses calculate the assets' earning potential, use, and useful life. The fixed asset efficiency can be analyzed by calculating the ratio of the fixed asset turnover.
Fixed Assets Turnover Ratio
This ratio is of more significance to the manufacturing industry than the other industries as there is a substantial purchase of property, plant & equipment in the manufacturing concern to get the required output.
The Formula of Fixed Asset Turnover Ratio -
Where,
- Net sales are sales less returns and discounts
- And average fixed assets = (opening fixed assets + closing fixed assets) / 2
For example, Tricot Inc. reported its sales for the financial year 2018-19 as $400,000, and out of these sales returned were $4,000. Also, it reported its total property, plant, and equipment (PPE) as of 31st March 2019 as $200,000. The balance of PPE as of 1st April 2018 was $160,000.
- Now net sales = $400,000 - $40,000 = $360,000
- Average fixed assets =($160,000 + $200,000)/2 =$180,000
So, Fixed Asset Turnover Ratio will be -

This ratio reflects how efficiently the company's management uses its substantial fixed assets to generate revenue for the firm. The higher the ratio, the higher the efficiency of the fixed assets.
B) Current Assets
Current assets are such assets that are likely to be converted into cash within a year. The current assets include cash, account receivable, and inventories.
The ratios which help in the analysis of current assets are
Current Ratio
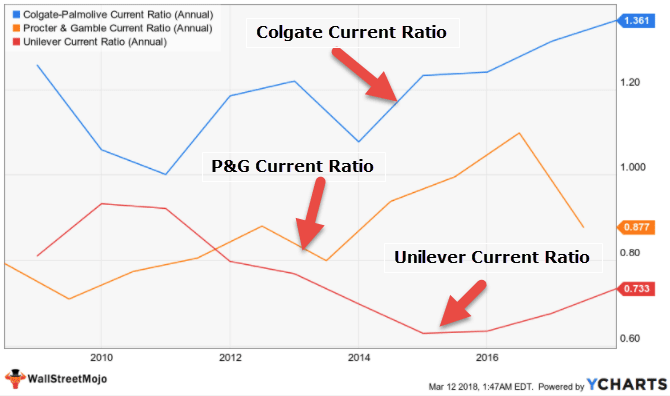
It is a liquidity ratio that measures the ability of the company to pay off its short-term debts.
The formula for the current ratio is:
Where
- Current assets = Cash & Cash equivalents + Inventories + Accounts receivable + other assets that can be converted into cash within a year;
- Current Liabilities = Accounts payable + short term debt+ current portion of long term debt
Quick Ratio
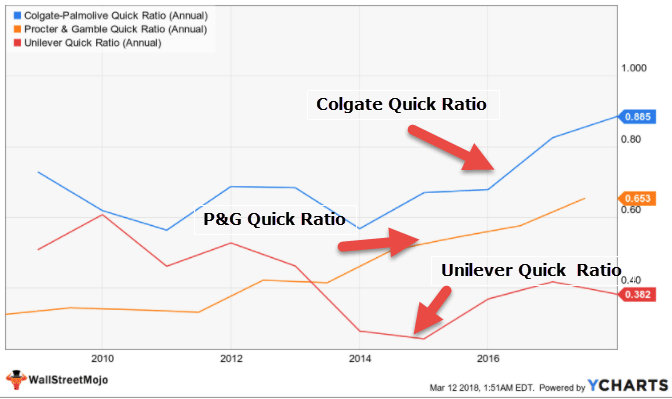
It is a liquidity ratio that measures the company's short-term liquidity position by calculating the company's ability to pay off its current liabilities with the use of its most liquid assets.
- Where, quick assets = Cash & cash equivalents + Accounts receivable + other short term assets
- Current liabilities = Accounts payable + short term debt + current portion of long term debt
Example: Microsoft Inc. is a manufacturing concern which reported the following items in the balance sheet:
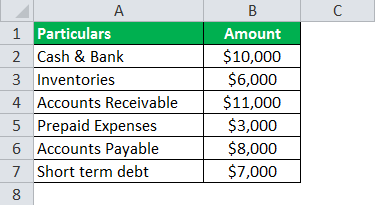
Now the Total current assets = $10,000 + $6,000 + $11,000 + $3,000 = $30,000
- Quick assets = $10,000+ $11,000 = $21,000
- Total current liabilities = $8,000 + $7,000 = $15,000
- Therefore, current ratio = $30,000/$15,000 = 2:1
So, Quick Ratio will be -
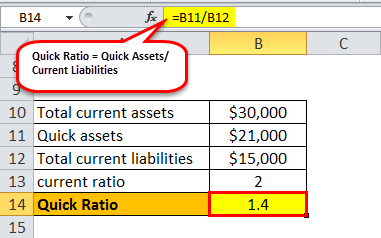
Quick ratio = $21,000/$15,000 = 1.4:1
C) Cash
Investors are more attracted towards the company who is having plenty of cash reported on their balance sheet
as the cash offers security to the investors because it can be used in tough times. Increasing cash year to year is a good sign, but diminishing cash can be considered a sign of trouble. But if plenty of cash is retained for many years, investors should see why the management is not putting it into use. The reasons for maintaining a considerable amount of cash include management's lack of interest in the investment opportunities, or maybe they are short-sighted, so they do not know how to utilize the cash. The company does even the cash flow analysis to determine its source of cash generation and its application.
D) Inventories
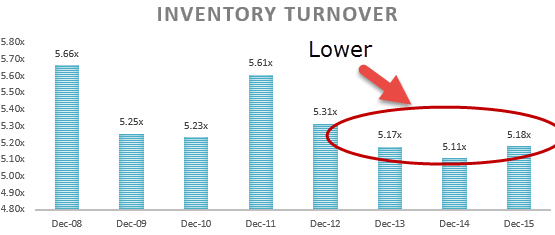
Inventories are the finished goods accumulated by the company for selling to its customers. The investor will see how much money is tied up by the company in its inventory. To analyze the inventory, a company calculates its inventory turnover ratio, which is calculated as below:
Inventory Turnover Ratio = Cost of goods sold / Average inventory
Where,
- Cost of goods sold = Opening stock + purchases – Closing stock
- Average inventory = (Opening inventory + Closing inventory) / 2
This ratio calculates how fast the inventory is converted into sales. A higher inventory ratio shows that the goods are sold quickly by the company and vice versa.
E) Accounts Receivables
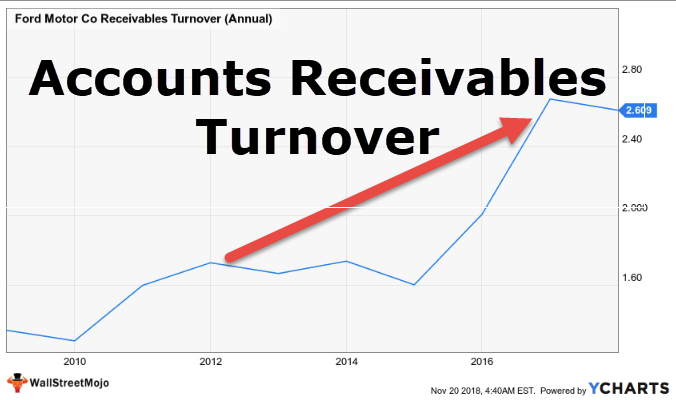
Accounts receivable is the money due to the debtors of the firm. By analyzing accounts receivable, a company analyzes the speed at which the amount is collected from the debtors.
For this, the company calculates the Accounts receivable turnover ratio, which is calculated as below:
Accounts Receivable Turnover Ratio = Net credit sales/Average accounts receivable
Where,
- Net credit sales = Sales – Sales return - discounts
- Average accounts receivable = (Opening accounts receivable + closing accounts receivable) / 2
This ratio calculates the number of times the company collects the average accounts receivable over a given period. The higher the ratio, the higher the company's efficiency in collecting it debtors.
Video Explanation of Balance Sheet
#2 - How to Analyze Liabilities on the Balance Sheet?
Liabilities include current liabilities and non-current liabilities. Current liabilities are obligations of the company to be paid within a year, whereas non-current liabilities are the obligations that are to be paid after a year.
A) Non-Current Liabilities

It can be done by the debt to equity ratio. The formula for the same is:
- Where long term debts = debts to be paid off after a year
- Shareholders equity = Equity share capital + preference share capital + accumulated profits
For example, Mania Inc. has its equity share capital amounting to $100,000. Its Reserves and surplus are $20,000, and the long term debts are $150,000
Therefore the debt to equity ratio = $150,000 / ($100,000 + $20,000) = 1.25:1
This ratio measures the proportion of the debt fund as compared to equity. It helps to know the relative weights of the debts and the equity.
B) Current Liabilities
The current liabilities can also be analyzed with the help of the current ratio and the quick ratio. Both ratios are discussed above in the current assets section.
C) Equity
The amount of capital contributed by the shareholders is represented by the Equity and is also called shareholder's equity. Equity is calculated by subtracting total liabilities from the total assets.
There are various ways in which equity can be analyzed.
ROE

Return on equity is an important determinant that shows the company how the company is managing shareholders' capital. It is calculated by dividing the net income by the shareholder's equity. Higher the ROE, the better it is for shareholders.
For example, XYZ had $20 million net income last year and shareholders' equity of $40 million last year, then.
ROE = $20,000,000/$40,000,000 = 50%
It shows that XYZ generated $0.50 profit for every $1 of shareholders' equity with an ROE of 50%.
Debt to Equity Ratio
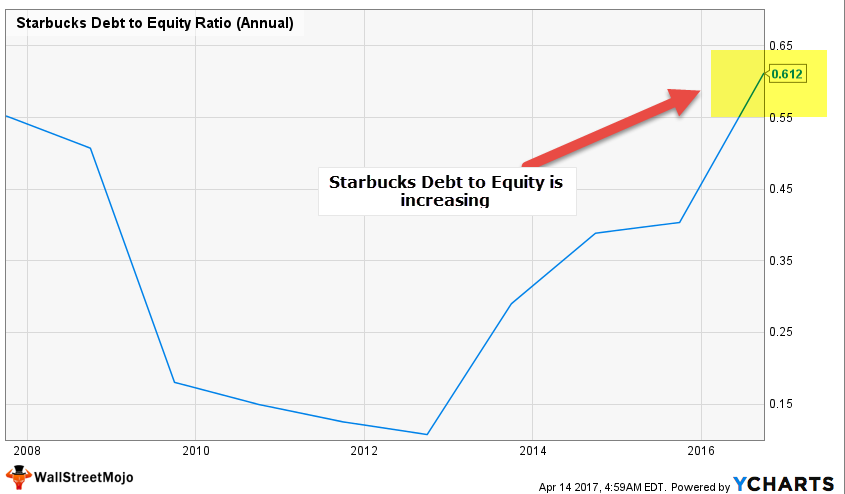
Another ratio that helps analyze equity is the debt-equity ratio. The same is explained in the case of non-current liabilities, where Mania Inc has a debt-equity ratio of 1.25. The company has a higher debt-equity ratio as the company's debt is more than the equity. A lower debt-equity ratio implies more financial stability. Companies having a higher debt-equity ratio, like in the present example, are considered riskier to the investors and the creditors of the company.
Frequently Asked Questions (FAQs)
A comparative balance sheet refers to a side-by-side comparison of a current and previous accounting period's whole balance sheet report. For example, business owners or investors may compare a date-to-date company to understand financial performance trends.
The balance sheet analysis is essential as it enables details about the company's resources, such as assets, and the sources of capital, such as equity, liabilities, or debt. Such information helps an analyst examine a company's capability to pay for near-term operating requirements, satisfy forthcoming debt obligations, and distribute to owners.
Balance sheet analysis comprises three types: comparative balance sheets, vertical balance sheets, and horizontal balance sheets
Recommended Articles
This article has been a guide to Balance Sheet Analysis. Here we discuss step by step how to analyze balance sheet assets, liabilities, and equity along with examples and explanations. You may learn more about accounting from the following articles –

