What Are The Types Of Financial Analysis?
The financial analysis examines and interprets data of various types according to their suitability. The most common types of financial analysis are vertical analysis, horizontal analysis, leverage analysis, growth rates, profitability analysis, liquidity analysis, efficiency analysis, cash flow, rates of return, valuation analysis, scenario and sensitivity analysis, and variance analysis.
Financial analysis means scrutinizing the financial statement to reach a productive outcome that helps investors and other stakeholders maintain their relationship with the company. There are numerous types that experts and analysts use to analyze financial information.
- Financial analysis is the evaluation method for business and finance-oriented transactions to identify performance and capability.
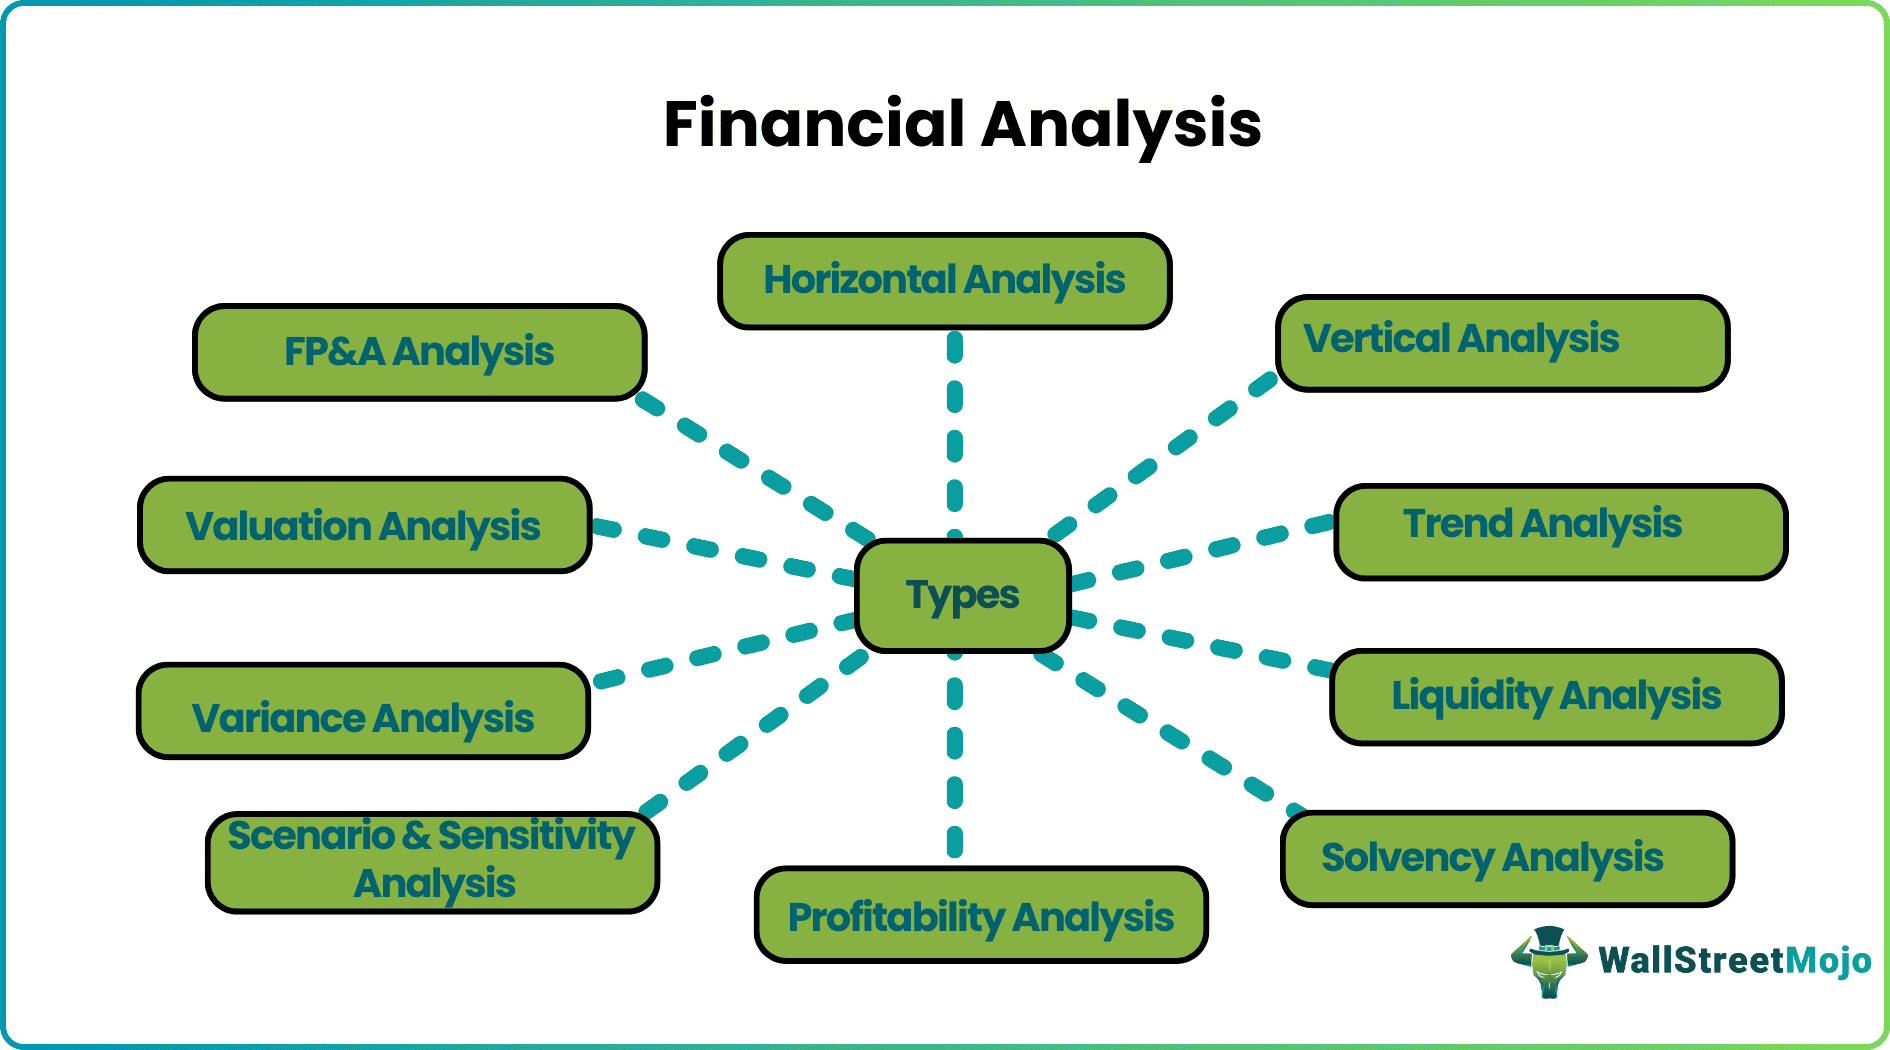
- The top 10 types of financial analysis are horizontal analysis, vertical analysis, trend analysis, liquidity analysis, solvency analysis, liquidity analysis, scenario & sensitivity analysis, variance analysis, valuation analysis, and FP&A analysis.
- Financial analysis is said to be the essential ingredient in business activity.
- Without financial analysis, running a business may be futile. Therefore, executing economic research and carefully handling it is necessary for every organization.
Types Of Financial Analysis Explained
The types of financial analysis ratios are considered the main ingredient in business activity. With this, running a business successfully is possible. Hence, executing and carefully handling economic research is necessary for every organization. Considerably, they should also duly implement all the analysis findings.
There are many types of financial analysis reports that are very useful and frequently used in the business to achieve its objectives. Trend analysis explains the market trend of the entity over a period of time for which past data and chart patterns are used for interpretation. Similarly, profitability, solvency or liquidity analysis tell the financial condition of the company that is used by analysts and investors for making important investment decisions. Even cash flow and valuation analysis says the inflow and outflow of cash in the business and the current valuation of the company.
In this way, various types of financial analysis in management accounting are used. Studies and evaluations consider the financial data of the past and current year, which the management uses for decisions related to investment in projects, technology, innovation, changes in operation procedures, or any alteration in the products and services. Moreover, the other stakeholders, like lenders and investors, use them to decide their expected return on investment or the company’s creditworthiness.
Different Types Of Financial Analysis
Given below are some of the common types of financial analysis ratios using financial data that companies frequently use during their day-to-day operations.
- Horizontal Analysis
- Vertical Analysis
- Trend Analysis
- Liquidity Analysis
- Solvency Analysis
- Profitability Analysis
- Scenario & Sensitivity Analysis
- Variance Analysis
- Valuation Analysis
- FP&A Analysis
Now, we will discuss the above-described ratios with a detailed explanation.
#1 – Horizontal Analysis
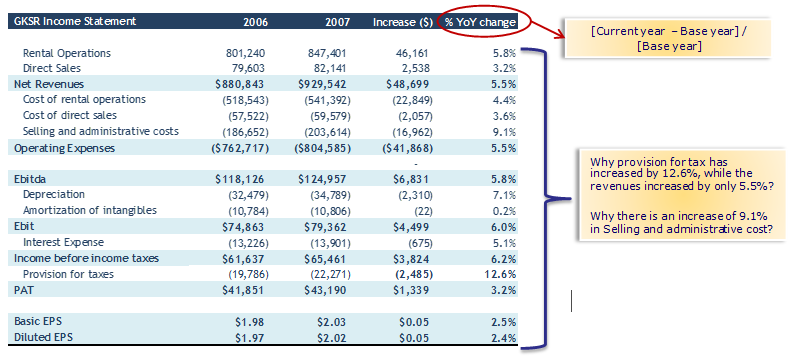
The horizontal analysis measures the financial statements line of items with the base year. It compares the figures for a given period with the other period.
- Pros – It helps to analyze the company’s growth from year on year or quarter on quarter with the increase in operations of the company.
- Cons – The company operates in the industrial cycle. Therefore, if the industry is downgrading despite the company’s better performance owing to specified factors that impact the industry, trend analysis will indicate the negative growth in the company
#2 – Vertical Analysis
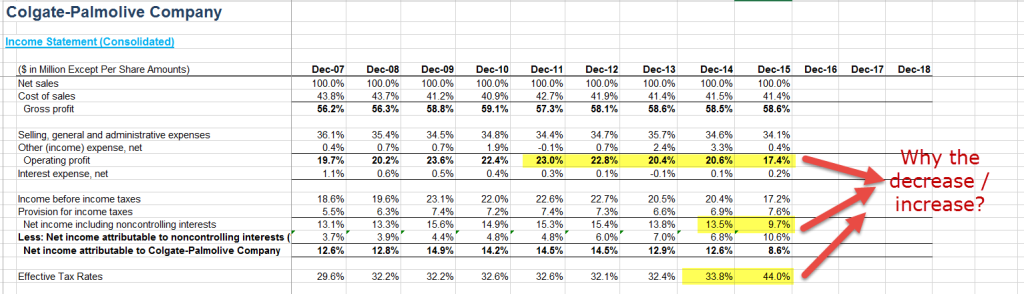
The vertical analysis measures the line items of the income statement or balance sheet by taking any line item of the financial statement as a base and disclosing the same in percentage form.
For example, the income statement discloses all the line items in percentage form by taking base as net sales. Similarly, the balance sheet on the asset side reveals all the line items in the percentage form of total assets.
- Pros – The vertical analysis helps compare the entities of different sizes as it presents the financial statements in final form.
- Cons – It solely represents a single period’s data, so it avoids comparison across different time phases.
To learn more about vertical financial analysis, we may refer to the following articles: –
- Income Statement Vertical Analysis
- The Formula of Vertical Analysis
- Income statement common size
- Balance Sheet Common Size
#3 – Trend Analysis

Trend analysis means identifying patterns from multiple periods and plotting those in a graphical format to derive actionable information.
#4 – Liquidity Analysis
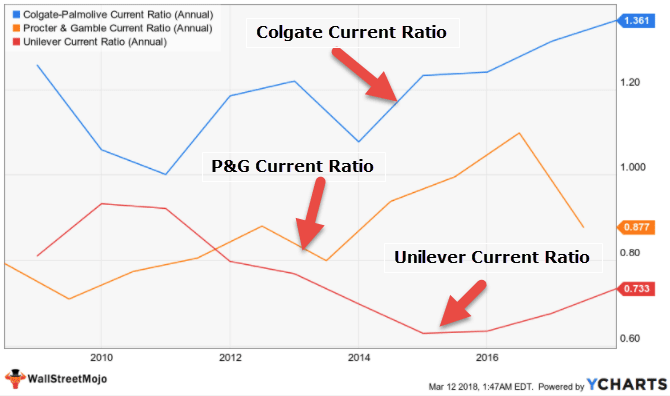
This method is equally important among various types of financial analysis in management accounting. The short-term research focuses on routine expenses. It analyzes the short-term capability of the company for day-to-day payments of trade creditors, short-term borrowings, statutory payments, salaries, etc. Its main objective is to verify that the appropriate liquidity is maintained thoroughly for the given period and that all liabilities are met without default.
The short-term analysis is carried out using ratio analysis technique that uses various ratios like liquidity ratio, current ratio, quick ratio, etc.
#5 – Solvency Analysis

The long-term analysis is also termed solvency analysis. The focus of this analysis is to ensure the good solvency of the company quickly and check whether the company can pay all the long-term liabilities and obligations. It gives stakeholders confidence about the entity’s survival with proper financial health.
Solvency ratios like debt to equity ratio, equity ratio, debt ratio, etc., give an accurate picture of the financial solvency and burden on the firm in the form of external debts.
#6 – Profitability Analysis
Profitability financial analysis helps us understand how the company generates revenue.
The decision related to investment is one of the critical decisions of all business people that ensure the maximum profit from the investment made in the project. To verify the decision’s viability, they need to conduct a profitability analysis to check the rate of return in a given period. These will help the investor in obtaining assurance of the safekeeping of funds.
The following tools are used to analyze the same: –
- Profit margin calculation
- Operating profit margin calculation
- EBIT margin calculation
- EBIDTA margin calculation
- Earnings before taxes calculation

#7 – Scenario & Sensitivity Analysis
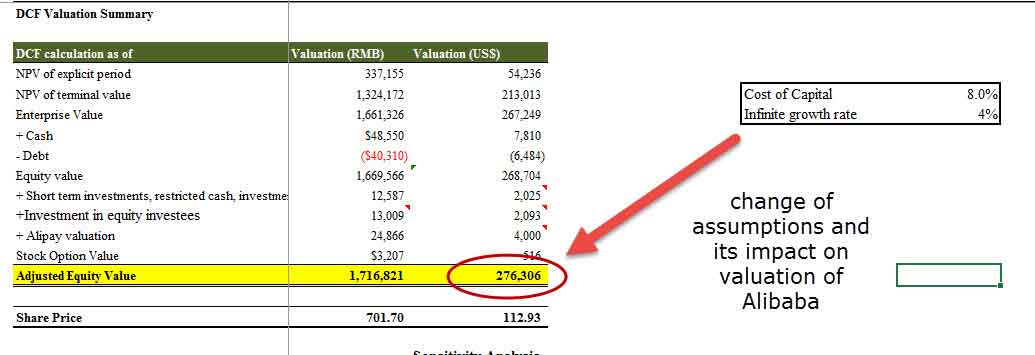
In business, day in and day out, various changes continue to emerge depending on the economic outlook, varied changes in tax structures, banking rates, duties, etc. Each of these determinants highly affects the financials. Therefore, the treasury department must conduct a sensitivity analysis concerning each factor and analyze their effects on the company’s financials.
Among various types of financial analysis we can use the following to do sensitivity analysis: –
- Sensitivity Analysis
- Data table using excel
- Two-variable data table using Excel
- One variable data table using Excel
#8 – Variance Analysis
The business operates on estimates and budgets after completing transactions. It is also crucial to check the variance between the budget and assessments with the actual one. This variance analysis will prevent any loopholes in the process and help an entity take corrective actions to avoid the same. Variance analysis can be carried out by standard costing technique comparing estimated, standard, and actual costs.
#9 – Valuation
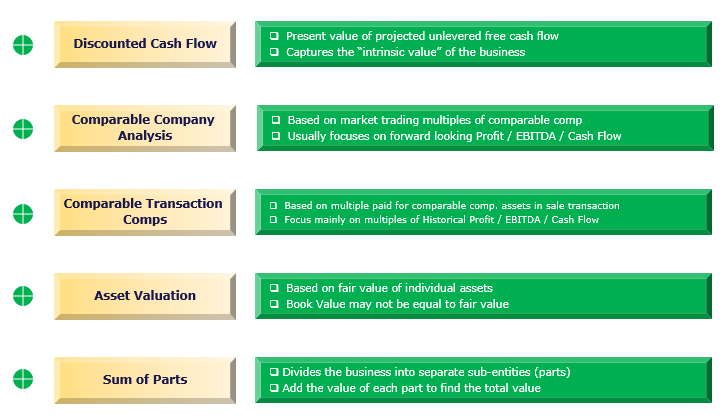
Valuation analysis means deriving the company’s fair valuation. We may employ one of the following valuation financial analysis tools: –
- Dividend discount model
- DCF formula
- Relative valuation multiples
- Transaction multiples
- SOTP valuation
#10 – FP&A Analysis
Every company has its Financial Planning and Analysis (FP&A) department to analyze the internal organization’s various data points and construct the Management Information System (MIS) to report to the top management. The MIS is vital for the company and shall be published and unpublished. Furthermore, among various types of financial analysis, such analysis helps top management adopt preventive strategies that can help avoid any major setbacks.
Examples
Let us take a simple example to understand the concept.
We assume ABC Ltd plans pharmaceutical sector, plans to invest money into expansion. It wants to open more retail stores in a few prominent parts of the city and in rural areas. But to achieve this aim, the company has to do a solvency analysis to check the debt-bearing capacity, make a robust cash flow analysis to track whether its collection methods are research, conduct horizontal and vertical analysis to study its overall performance, etc.
Thus, companies do various types of financial analysis reports with their financial data during different decision-making processes.
Frequently Asked Questions (FAQs)
What are the basic types of financial analysis?
The basic types of financial analysis are horizontal, vertical, leverage, profitability, growth, liquidity, cash flow, and efficiency. The two main types of financial analysis are fundamental analysis and technical analysis.
What are the five goals of the financial analysis?
A financial analysis’s main objective is to determine whether a given organisation is secure, solvent, liquid, or profitable enough to justify a financial investment. It is employed to assess financial trends, establish monetary policy, create long-term corporate activity plans, and choose investments in projects or businesses.
What are the three tools of financial analysis?
The three tools of financial analysis are ratios analysis, vertical analysis, and horizontal analysis.
What are the types of financial analysis models?
The primary type of financial analysis models are accounting models and quantitative models.
Recommended Articles
This article is a guide to what are Types Of Financial Analysis. We explain different types of it along with example. You may learn more about financial analysis from the following articles: –