Table Of Contents
What Are Accounting Ratios?
Accounting ratios indicate the company's performance by comparing various figures from financial statements and the results/performance of the company over the last period, suggesting the relationship between two accounting items where financial statement analysis performs using liquidity, solvency, activity, and profitability ratios.

They are useful in analyzing the company’s performance and financial position. It acts as a benchmark and is used to compare industries and companies. However, they are more than just numbers to help understand their stability. In addition, it allows investors with stock valuation. Ratios can be used for macro-level analysis, but in-depth research needs to understand the business properly.
Table of contents
- Accounting ratios show the company's conduct by comparing different figures from financial statements and the company results/performance over the preceding years, indicating the relationship between two accounting items where financial statement analysis functions utilizing liquidity, solvency, activity, and profitability ratios.
- Liquidity ratios, profitability ratios, leverage ratios, and activity/efficiency ratios are accounting ratios.
- It also allows investors with stock valuation. One can use them for macro-level analysis, but in-depth research must determine the business appropriately.
Accounting Ratios Explained
Accounting ratios are an integral part of the various sets of ratios used in financial analysis to evaluate the profitability and level of efficiency with which a business operates in the competitive market. It helps companies communicate their performance and analysts and investors asses the overall financial health of an organization which facilitates investment related decisions.
In the concept of financial accounting ratios two items taken from the financial statements of the organization’s balance sheet is compared with each other in the form of ratio analysis. The result is expressed as a number or a percentage and compared with simiral ratios of the past data to evaluate the company performance. Similarly, is comparison can be done to get an idea about which way the performance is trending and make a numerical estimate about the future potential of growth.
These important accounting ratios proves to be extremely beneficial for the business because the projections can be used for planning related to production, pricing, revenue generation and expected sales figures, budgeting or investments. The management and stakeholders can assess the position of the business among its competitors in the market.
There are four main types of accounting ratios: -
- Liquidity Ratio
- Profitability Ratio
- Leverage Ratio
- Activity Ratios
These ratios also help in identify problem areas and design strategies for improvement depending of the urgency of the problems. The management can also determine how much effective the newly implemented policies and procedures proved to be considering one or more accounting periods so that they can be strictly followed and modified as per result. Let us discuss each of these in detail.
Types

There are four types of accounting ratios analysis with formulas: -
#1 - Liquidity Ratios
This first accounting ratio formula is used to ascertain the company's liquidity position. It is used to determine its paying capacity towards its short-term liabilities. A high liquidity ratio indicates that the company's cash position is good. A liquidity ratio of two or more is acceptable.
Current Ratio
The current ratio compares the current assets to the current liabilities of the business. This ratio indicates whether the company can settle its short-term liabilities.
Current Ratio = Current Assets / Current Liabilities
Current assets include cash, inventory, trade receivables, other current assets, etc. Current liabilities include trade payables and other current liabilities.
Quick Ratio
The quick ratio is the same as the current ratio, except it considers only quick assets that are easy to liquidate. It is also called an acid test ratio.
Quick Ratio = Quick Assets / Current Liabilities
Quick assets exclude inventory and prepaid expenses.
Cash Ratio
The cash ratio considers only those current assets immediately available for liquidity. Therefore, the cash ratio is ideal if it is one or more.
Cash Ratio = (Cash + Marketable Securities) / Current Liabilities
#2 - Profitability Ratios
This accounting ratio formula indicates the company’s efficiency in generating profits. It shows the earning capacity of the business in correspondence to the capital employed.
Gross Profit Ratio
The gross profit ratio compares the gross profit to the company's net sales. It indicates the margin earned by the business before its operational expenses. It is represented as a percentage of sales. The higher the gross profit ratio, the more profitable the company is.
Gross Profit Ratio = (Gross Profits/ Net revenue from Operations) X 100
Net Revenue from Operations = Net Sales (i.e.) Sales (-) Sales Returns
Gross Profit = Net Sales – Cost of Goods Sold
The cost of goods sold includes raw materials, labor cost, and other direct expenses.
Operating Ratio
The operating ratio expresses the relationship between operating costs and net sales. It is used to check the efficiency of the business and its profitability.
Operating Ratio = ((Cost of Goods Sold + Operating Expenses)/ Net Revenue from Operations) X 100
Operating expenses include administrative expenses, selling, and distribution expenses, salary costs, etc.
Net Profit Ratio
The net profit ratio in accounting ratios analysis shows the overall profitability available for the owners as it considers both the operating and non-operating income and expenses. Higher the ratio, the more returns for the owners. It is an important ratio for investors and financiers.
Net Profit Ratio = (Net Profits After Tax / Net Revenue) X 100
Return on Capital Employed (ROCE)
ROCE shows the company’s efficiency concerning generating profits compared to the funds invested in the business. It indicates whether the funds are utilized efficiently.
Return on capital employed = (Profits Before Interest and Taxes / Capital Employed) X 100
Earnings Per Share
Earnings Per Share show the company's revenues concerning one share. It is helpful to investors for decision-making about the purchasing/ sale of shares as it determines the return on investment. It also acts as an indicator of dividend declaration or bonus issues shares. If earnings per share are high, the company's stock price will be increased.
Earnings Per Share = Profit Available to Equity Shareholders / Weighted Average Outstanding Shares
#3 - Leverage Ratios
These accounting ratios are known as solvency ratios. That is because it determines its ability to pay for its debts. Investors are interested in this ratio as it helps determine how solvent the company is to meet its dues.
Debt-to-Equity Ratio
It shows the relationship between total debts and the company's total equity. It is useful to measure the leverage of the company. A low ratio indicates that the company is financially secure; a high ratio suggests it is at risk as it is more dependent on debts for its operations. It is also known as the gearing ratio. The ratio should be a maximum of 2:1.
Debt-to-Equity Ratio = Total Debts / Total Equity
Debt Ratio
The Debt Ratio measures the liabilities in comparison to the assets of the company. A high ratio indicates that the company may face solvency issues.
Debt Ratio = Total Liabilities/ Total Assets
Proprietary Ratio
It shows the relationship between total assets and shareholders’ funds. It indicates how much of shareholders’ funds are invested in the assets.
Proprietary Ratio = Shareholders Funds / Total Assets
Interest Coverage Ratio
The Interest Coverage Ratio measures its ability to meet its interest payment obligation. A higher ratio indicates that the company earns enough to cover its interest expense.
Interest Coverage Ratio = Earnings Before Interest and Taxes / Interest Expense
#4 - Activity/Efficiency Ratios
Working Capital Turnover Ratio
It establishes the relationship of sales to net working capital. A higher ratio indicates that the company’s funds are efficiently used.
Working Capital Turnover Ratio = Net Sales/ Net Working Capital
Inventory Turnover Ratio
The Inventory Turnover Ratio indicates the pace at which the stock is converted into sales. Therefore, it is useful for inventory reordering and understanding the conversion cycle.
Inventory Turnover Ratio = Cost of Goods Sold / Average Inventory
Asset Turnover Ratio
The Asset Turnover Ratio indicates the revenue as a percentage of the investment. A high ratio suggests that its assets are managed better, yielding good income.
Asset Turnover Ratio = Net Revenue / Assets
Debtors Turnover Ratio
The debtors’ turnover ratio indicates how efficiently debtors' credit sales value is collected. In addition, it shows the relationship between credit sales and the corresponding receivables.
Debtors Turnover Ratio = Credit Sales / Average Debtors
Examples
Let us understand the concept of key accounting ratios with the help of some suitable examples:
Example#1
X Corp. makes a total sale of $6,000 in the current year, of which 20% is cash sales. Debtors at the beginning are $800 and at the year-end are $1,600.
Credit sales = 80% of the total sales = $6,000 * 80% = $4,800
Average debtors = ($800+$1,600)/2 = $1,200.
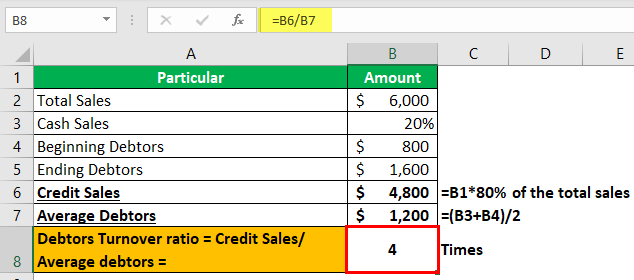
Debtors Turnover Ratio = Credit Sales/Average Debtors = $4,800 / $1,200 = 4 times.
Example#2
Duo Inc. has earnings before interest and taxes of $1,000, and it has issued debentures worth $10,000 @ 6%.
Interest expense = $10,000*6% = $600
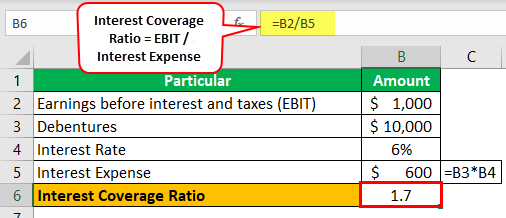
Interest Coverage Ratio = Earnings Before Interest and Taxes / Interest Expense = $1,000/$600 = 1.7:1.
So, the current earnings before interest and taxes can cover the interest expense 1.7 times.
Example#3
INC Corp. has total debts of $10,000, and its total equity is $7,000.
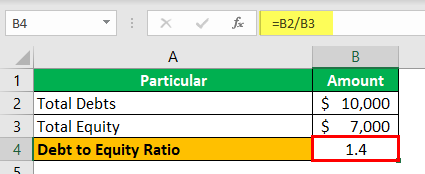
Debt-to-Equity ratio = $10,000/ $7,000 = 1.4:1
Example#4
R&M Inc. had profits before interest and taxes of $10,000, total assets of $1,000,000, and liabilities of $600,000.
Capital employed = $1,000,000 – $600,000 = $400,000.

Return On Capital Employed = $10,000/ $400,000 = 2.5%.
Example#5
Zinc Trading Corp. has gross sales of $100,000, sales return of $10,000, and the cost of goods sold of $80,000.
Net sales = $100,000 – $10,000 = $90,00
Gross Profit = $90,000 – $80,000 = $10,000
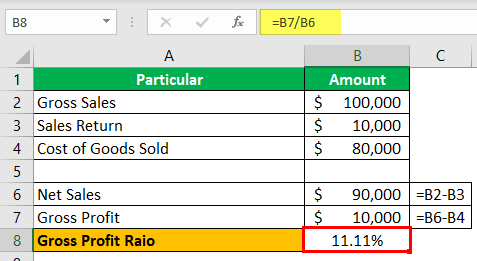
Gross Profit Ratio = $10,000/ $90,000 = 11.11%
Example#6
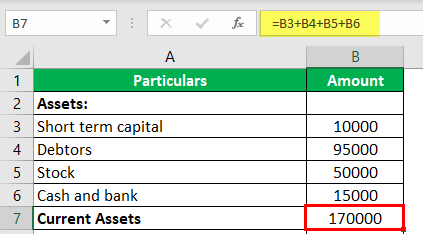
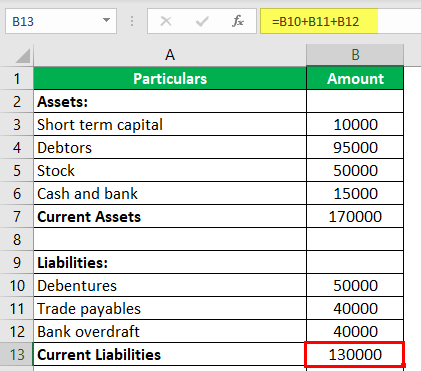
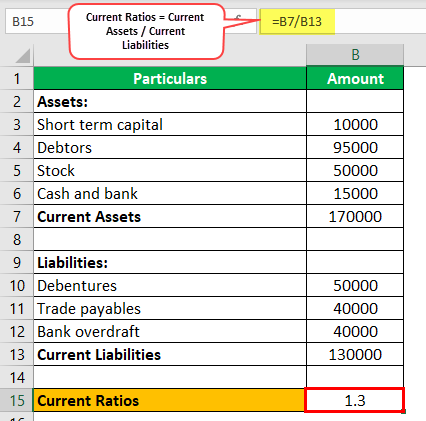
ABC Corp. has the following assets and liabilities on its balance sheet.
Current Assets = Short-term Capital + Debtors + Stock + Cash and Bank = $10,000 + $95,000 + $50,000 + $15,000 =$170,000.
Current Liabilities = Debentures + Trade Payables + Bank Overdraft = $50,000 + $40,000 +$40,000 = $130,000.
Current Ratio = $170,000/ $130,000 = 1.3
Benefits
Every financial concept has both positive and negative effects. Let us analyse the same in case of key accounting ratios in details.
- Assessment of performance – The main aim of calculating these ratios is to make assessment of the performance of the business over the years and how it has been able to deliver the result that was expected from it on a year-on-year or quarter-on-quarter basis.
- Assessment of liquidity levels – The ratios also help in evaluating a very important metric, that is the liquidity levels. Any business should essentially have strong levels of liquid assets that is beneficial to meet the daily expenses as well as any unforseen contingency that might arise. Liquidity ensures sustainability and ability to absorb shocks in times of emergency.
- Efficiency of operation- They are useful in evaluation of operational efficiency and effectiveness of the implementation of policies and procedures related to production, sales, revenue budgeting, pricing, management operations, etc. If the results of the ratios prove to be positive, it can be assumed that the organization is in the right track.
- Investor decision – The investors widely use these ratios to make investment decisions. Lenders assess the creditworthiness of the company before lending money. Good ratios levels prove that the business is running smoothly and has future potential to rise and grow. This creates a good image in the market, raising stock prices and investors get the opportunity to earn good returns.
- Management decision – The management continuously depends on these important accounting ratios for decision making related to the future plans of investment, expansion and growth because the accounting ratios act as a guide or a benchmark to identify areas of the business that are showing high performance and areas that need attention. This helps in maintaining a balanced approach to the entire operational process and deal with the problems and design effective solutions for the same.
Limitations
Some limitations or disadvantages of the concept are as given below:
- Based on past data – An important disadvantage of the concept is that it is based on the past performance and data to a huge extent. It is not necessary that the past performance will work in the current and future in that same manner, especially in the ever changing economic, social and political landscape.
- Subjective – The interpretation of the ratios is sometimes quite subjective in the sense that the data used may not always be accurate of authentic and mislead the users in many ways.
- Sometimes misleading – Misrepresentation is a huge problem in this concept because the data can be manipulated and presented in such a way so as to make the company operations appear very strong and in an upward trend over the years. The investors may take incorrect decisions based on these figures which has a hugely negative long term effect on both company and stakeholders.
- Industry variation – The interpretation of the raios will not be the same across all industries. It will depend on the sector or industry type, its performance, market demand, supply, price, and many other internal and external factors across industries. Therefore, it becomes difficult to compare them across companies if they belong to different industry.
- Changes in accounting rules – Any change in accounting rules and laws will change the interpretation of the accounting ratios, resulting in a different final decision under same circumstance as before. Therefore, stakeholders and management aways need to be up to date about and change in rules and laws related to accounting.
- Inflation – Inflation has an important effect in the sense that due to inflation the current value of assets will go down and it becomes difficult to compare the historical data with the current one due to differences in valuation.
Frequently Asked Questions (FAQs)
The accounting ratios or ratios in management accounting have four ratios: liquidity ratios, activity ratios, solvency ratios, and profitability ratios.
One can divide financial ratios into six critical areas of analysis: liquidity, profitability, debt, operating performance, cash flow, and investment valuation. The financial ratios representation needs the income statements and balance sheets knowledge.
Accounting ratios are an essential financial ratios subdivision. It is a group of metrics utilized to determine the company's capability and profit based on the financial reports. Moreover, they offer a way of denoting the relationship between one accounting data point to another. In addition, they are also the basis of ratio analysis.
Companies use accounting ratios to know particular trends over time. In addition, one measure for analyzing your business's financial state. These ratios can guide lenders and investors on if the business performance is worth giving or investing them.
Recommended Articles
This article is a guide to what are Accounting Ratios. We explain their types along with examples and their limitation and benefits. You can learn more about accounting from the following articles: -

