Table Of Contents
What Are Ratio Analysis Types?
Ratio Analysis Types refer to different forms of ratio analyses that are conducted to figure out the exact status or progress of a business. The ratio analysis forms help analyze the company’s financial and trend of the company’s results over years. It is a fundamental tool that every company uses to ascertain the financial liquidity, debt burden, profitability, and how well it is placed in the market compared to its peers.
Some of the categories of ratio analysis include liquidity ratios, solvency ratios, profitability ratios, efficiency ratio, and coverage ratio which indicates the company’s performance. Various examples of these ratios include the current ratio, return on equity, debt-equity ratio, dividend payout ratio, and price-earnings ratio. These different types of ratio analysis make financial analysis easier to conduct for companies, thereby helping them plan their progress accordingly.
Key Takeaways
- Ratio analysis is a helpful tool for assessing a company's financial health and progress over time.
- It involves analyzing five categories of ratios, including liquidity, solvency, profitability, efficiency, and coverage. These ratios can give you valuable insights into the company's performance.
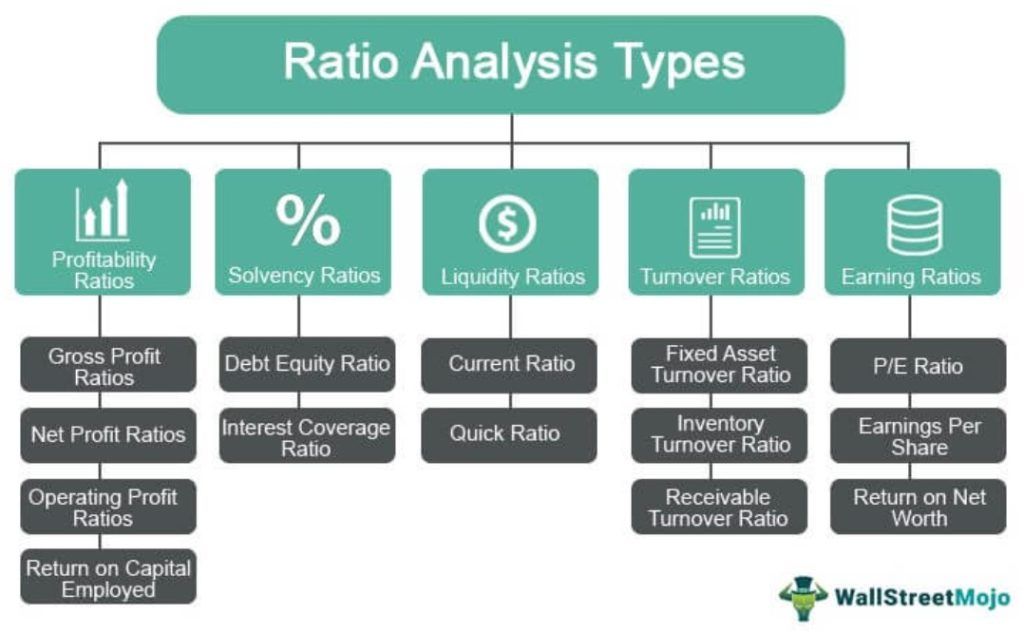
- Profitability ratios, solvency ratios, liquidity ratios, turnover ratios, and earning ratios are five types of ratio analysis.
- Financial analysis in companies can benefit from various types of ratio analysis. Top management can use it as a crucial tool for strategic business planning.
Ratio Analysis Explained in Video
Ratio Analysis Types Explained
Ratio analysis types exist in several form and based on the figures and assessment data that firms need to generate to understand its progress or decline, the analysts choose a specific type of it for further calculation and quantitative derivations. This is because not all ratio analysis type suits all kinds of requirements of a business. Hence, the ratio to be calculated for analysis must be chosen based on the kind of data required for it.
Though there are five widely used types of ratio analysis, choosing a random type may not help firms assess their current position in the market. For example, if a business desires to check its debt-to-equity ratio, it has to compute this particular ration for valid figures. Finding out gross profit ratio in such a scenario would not help organizations.
Therefore, it is important to choose the appropriate ratio analysis type for a more accurate and reliable overview of the business performance. So far as being correct in deriving a proper conclusion is concerned, multiple ratio analysis should be conducted for better support to the figures obtained. If more ratio analysis suggests growth, that means the business is on the right track. The numerator and denominator of the ratio to be calculated are taken from the financial statements, thereby expressing a relationship with each other.
This is done based on the type of ratio selected for analysis. For example, if a business wants to learn about the returns expected on the capital employed, the numerator will be Earnings Before Interests and Taxes (EBIT) and the denominator will be the capital employed. On the other hand, if the ratio to be obtained is the return on net worth, the numerator and denominator would be different, i.e., net profit and equity shareholder’s funds, respectively.
The above mentioned are some ratios analysis types that the company can use for its financial analysis. In this way, ratio analysis is a very important tool for any kind of strategic business planning by the company's top management.
Top 5 Types of Ratio Analysis
Every company has calculated different types of ratios analysis to evaluate business performance. The details of each one of them have been mentioned below for better clarity of ratio analysis types as a concept as well as its calculation:
Type #1 - Profitability Ratios
This type of ratio analysis suggests the returns generated from the Business with the Capital Invested.
Gross Profit Ratio

It represents the company's operating profit after adjusting the cost of the goods that are sold. The higher the gross profit ratio, the lower the cost of goods sold, and the greater satisfaction for the management.
Gross Profit Ratio Formula = Gross Profit/Net Sales*100.
Net Profit Ratio

It represents the company's overall profitability after deducting all the cash & no cash expenses: the higher the net profit ratio, the higher the net worth, and the stronger the balance sheet.
Net Profit Ratio Formula = Net Profit/Net Sales*100
Operating Profit Ratio

It represents the soundness of the company and the ability to pay off its debt obligations.
Operating Profit Ratio Formula = Ebit/Net sales*100
Return on Capital Employed
ROCE represents the company's profitability with the capital invested in the business.
Return on Capital Employed Formula = Ebit/Capital Employed
Importance of Profitability Ratios
Let us understand the importance of profitability ratios.
- These ratios can help gauge a business’s ability to earn profits from its assets, equity, and sales.
- Ratios like operating profit margin and gross profit margin show how efficiently a company can control its operating and production costs.
- Comparing these ratios of a company with those of its peers can provide key insights into its position in the market.
Type #2 - Solvency Ratios
These ratio analysis types suggest whether the company is solvent & can pay off the lenders' debts or not.
Debt-Equity Ratio

This ratio represents the leverage of the company. A low d/e ratio means that the company has a lesser amount of debt on its books and is more equity diluted. A 2:1 is an ideal debt-equity ratio to be maintained by any company.
Debt Equity Ratio Formula = Total Debt/Shareholders Fund.
Where, total debt = long term + short term + other fixed payments shareholder funds = equity share capital + reserves + preference share capital – fictitious assets.
Interest Coverage Ratio

It represents how many times the company’s profits can cover its interest expense. It also signifies the company's solvency shortly since the higher the ratio, the more comfort to the shareholders & lenders regarding servicing of the debt obligations and smooth functioning of the business operations of the company.
Interest Coverage Ratio Formula = Ebit/Interest Expense
Importance of Solvency Ratios
Because of the following reasons, computing solvency ratios is important:
- Solvency ratios can help get an idea of a business’s financial standing and the risks associated with it.
- Healthy solvency ratios can indicate a sustainable mix of equity and debt in the capital structure. Thus, when these ratios are favorable, companies can find it easier to raise funds.
- Solvency ratios’ time analyses can help avoid financial distress and help in decision-making.
If individuals are looking to build comprehensive knowledge of solvency ratios and other financial ratios, they can take the Financial Planning & Analysis Course. The instructor uses his experience and expertise to provide a practical understanding of accounting ratios and other key financial concepts using examples.
Type #3 - Liquidity Ratios
These ratios represent whether the company has enough liquidity to meet its short-term obligations or not. Higher liquidity ratios are more cash-rich for the company.
Current Ratio

It represents the company's liquidity to meet its obligations in the next 12 months. Higher the current ratio, the stronger the company to pay its current liabilities. However, a very high current ratio signifies that a lot of money is stuck in receivables that might not be realized in the future.
Formula = Current Assets / Current Liablities
Quick Ratio

It represents how cash-rich the company is to pay off its immediate liabilities in the short term.
Quick Ratio Formula = Cash & Cash Equivalents+Marketable Securities+Accounts Receivables/Current Liabilities
Importance of Liquidity Ratios
Calculating the liquidity ratios of a company is important for these reasons:
- These ratios provide a clear idea of an organization’s liquidity position.
- Interpreting these ratios can help one understand the financial risk associated with the business and its overall financial health.
- These ratios help evaluate a company’s resilience and financial stability.
Type #4 - Turnover Ratios
These ratios signify how efficiently the assets and liabilities of the company are used to generate revenue.
Fixed Assets Turnover Ratio

Fixed asset turnover represents the efficiency of the company to generate revenue from its assets. In simple terms, it is a return on the investment in fixed assets. Net Sales = Gross Sales – Returns. Net Fixed Assets = Gross Fixed Assets –Accumulated Depreciation.
Average Net Fixed Assets = (Opening Balance of Net Fixed Assets + Closing Balance of Net Fixed Assets)/2.
Fixed Assets Turnover Ratio Formula = Net Sales / Average Fixed Assets
Inventory Turnover Ratio

The Inventory Turnover Ratio represents how fast the company can convert its inventory into sales. It is calculated in days signifying the time required to sell the stock on an average. The average inventory is considered in this formula since the company's inventory keeps on fluctuating throughout the year.
Inventory Turnover Ratio Formula = Cost of Goods Sold/Average Inventories
Receivable Turnover Ratio

Receivables Turnover Ratio reflects the efficiency of the company to collect its receivables. It signifies how many times the receivables are converted to cash. A higher receivable turnover ratio also indicates that the company is collecting money in cash.
Receivables Turnover Ratio Formula = Net Credit Sales/Average Receivables
Importance of Turnover Ratios
One can understand the importance of turnover ratios by going through the following points:
- These ratios offer insight into how efficiently an organization utilizes its assets for revenue generation.
- Such ratios can help evaluate the financial health of a company.
- Lenders often assess turnover ratios to get an idea of the repayment capability. This is because the ratios help figure out how efficiently a company can convert its resources into cash.
- Turnover ratios provide insights concerning business operations, which can assist in decision-making. These insights may be related to credit policies, asset utilization, and inventory management.
- Investors can use such ratios to assess profitability and determine whether making an investment is viable.
#5 - Earning Ratios
This ratio analysis type speaks about the company's returns for its shareholders or investors.
P/E Ratio

PE Ratio represents the company's earnings multiple and the market value of the shares based on the pe multiple. A high P/E Ratio is a positive sign for the company since it gets a high valuation in the market for m&a opportunities.
P/E Ratio Formula = Market Price per Share/Earnings Per Share
Earnings Per Share
Earnings Per Share represents the monetary value of the earnings of each shareholder. It is one of the major components looked at by the analyst while investing in equity markets.
Earnings Per Share Formula =(Net Income – Preferred Dividends) / (Weighted Average of Shares Outstanding)
Return on Net Worth
It represents how much profit the company generated with the invested capital from equity & preference shareholders both.
Return on Net Worth Formula = Net Profit/Equity Shareholder Funds. Equity Funds = Equity+Preference+Reserves -Fictitious Assets.
Importance of Earnings Ratios
- The earnings ratios help measure the growth potential of a company.
- The return on net worth ratio helps understand how efficiently a company can utilize shareholders’ equity to generate earnings.
- The EPS helps compare a company’s financial standing over the years. Generally, organizations that record a steady increase in EPS are a dependable option for investment.

