What Are Balance Sheet Ratios?
Balance sheet ratio indicates the relationship between two items of the balance sheet or analysis of balance sheet items to interpret a company’s results on a quantitative basis. and following balance sheet.
They are financial ratio which includes debt to equity ratio, liquidity ratios which include cash ratio, current ratio, quick ratio and efficiency ratios which include account receivable turnover, payable account turnover, inventory turnover ratio. These financial ratios are used to assess the expected returns, the risk associated, financial stability, etc., and majorly include balance sheet items like assets, liability, shareholders equity, etc.
Balance Sheet Ratios Explained
The balance sheet ratios are also known as financial ratios that form an important part of financial statement analysis. Every institution prepares the balance sheet as part of their financial statements that are an important component of evaluation and analysis of the entity’s ability to meet its financial needs.
The various balance sheet ratios analysis as given in the article later on, are treated as valuable metrics that give the management and stakeholders important insight into the financial health of the business. They help to decide whether the company meets some important criterias like solvency, efficiency, liquidity, etc. It helps decide whether it is a profit-making entity. Investors can make important financial decision based on these ratios because it clarifies the future potential of the business.
A strong balance sheet is a factor to decide the creditworthiness of any organization. Banks and other financial institution extend loans to them on the basis of these balance sheet ratios formulas because it gives them an insight into the capacity of the business to pay off the debts on time and help the lenders avoid bad debts. However, these ratios should be used in conjunction with other important industry benchmarks to make financial and investment decisions.
Types

The balance sheet ratios analysis can be classified into the following categories:
#1 – Efficiency Ratios
This type of Balance Sheet Ratio Analysis, i.e., efficiency ratio, is used to analyze how efficiently a company utilizes its assets. It indicates the overall operational performance of the company.
Various efficiency ratios are as follows:
Inventory Turnover Ratio
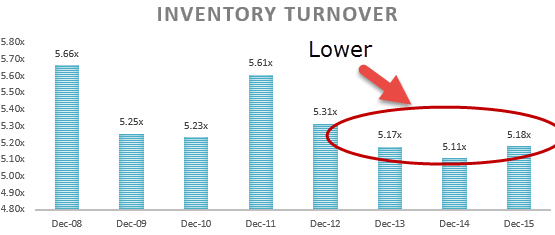
It is calculated by dividing the cost of goods sold by the average inventory available with the company on the balance sheet date.
Inventory turnover = Cost of Goods Sold/ Average inventory.
The inventory turnover ratio indicates how fast a company’s inventory is selling. In other words, they show how many times the company has sold its complete inventory and replenished it in a year. A low inventory turnover ratio is one of the key balance sheet ratios which indicates lower sales or that the company is holding up stocks of goods that are not in demand in the market. However, a high inventory turnover ratio doesn’t necessarily indicate the healthy position of the company unless it is coupled with good sales figures.
Receivable Turnover Ratio
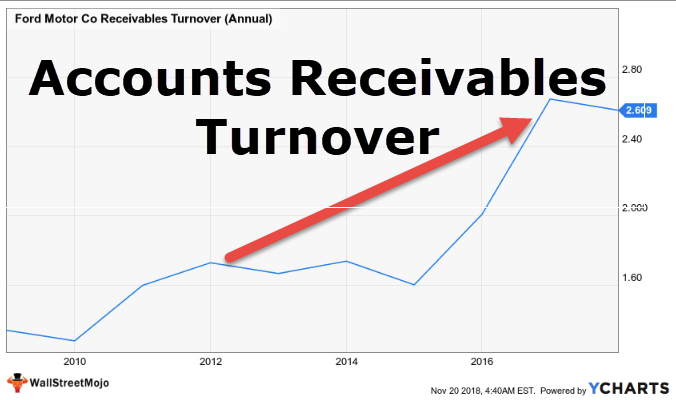
The receivable turnover ratio indicates how fast a company can recover its receivables from its customers. It is calculated as mentioned below:
A high receivable turnover ratio indicates that the money expected to be received by the company from its customers is stuck in credit, i.e., customers are struggling to pay the bills. However, receivable turnover needs to be analyzed compared to the company’s peers in the same industry since the credit period given to customers varies from industry to industry. For example, the cash and carry business will always have a less credit period than the manufacturing industry.
Payables Turnover Ratio

Payables Turnover Ratio is another one of the balance sheet ratios formulas and indicates how fast the company can pay its creditors. It is calculated by dividing purchases by creditors as on the balance sheet date.
It indicates whether a company is paying its suppliers on time or not. Further, a low payables turnover indicates that the company is not utilizing the benefits it might get by the suppliers’ credit period extended to them. Similar to the account receivable turnover ratio, the Payables ratio also needs to be analyzed based on the industry the company operates in.
Asset Turnover Ratio

Another one of the key balance sheet ratios is the Asset Turnover Ratio which is calculated simply by dividing the sales by the company’s total assets. It indicates how efficiently the company utilizes its assets to generate revenue.
Net Working Capital Turnover Ratio

The net working Capital Ratio indicates whether the company’s working capital has been effectively utilized to generate sales.
#2 – Liquidity Ratio
This type of Balance Sheet Ratio analysis is also known as the banker’s ratio. It indicates the firm’s ability to meet its short-term obligations. The liquidity ratio is industry dependent and varies majorly from industry to industry.
Current Ratio
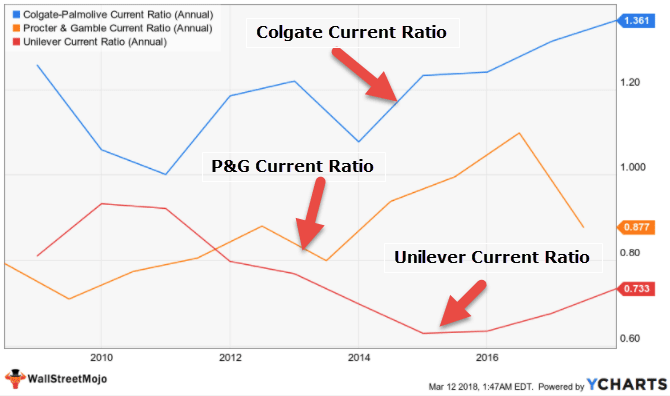
The Current Ratio indicates how readily a company can liquidate its current assets to pay off its current liabilities. It is calculated by dividing current assets by current liabilities.
The current ratio ideally should be above 1.33 times. CR less than one may indicate that the company is raising short-term funds from the market to create long-term assets, thus diverting funds.
Quick Ratio

The Quick Ratio is also known as the acid test ratio. It is a more stringent way of analyzing the liquidity of a company. It is calculated as under:
Inventory is a major part of the company’s current assets; however, at the time of distress, it might not be easily convertible to cash and hence cannot be used for instant debt payer recovery.
Cash Ratio
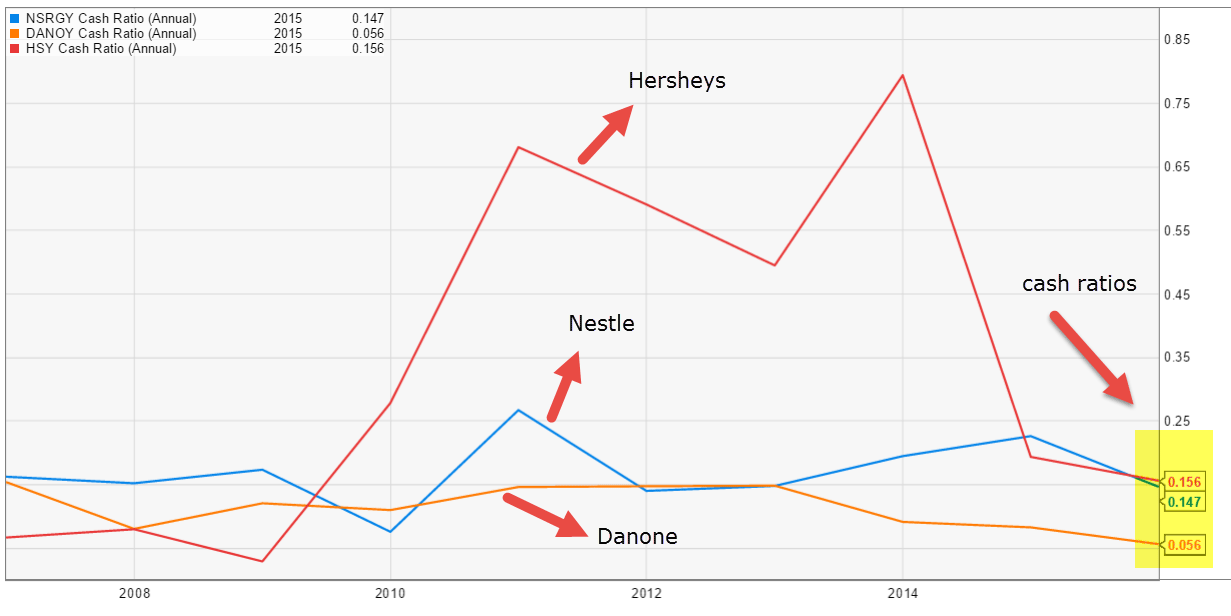
The most conservative liquidity ratio is the cash ratio. Cash is the most liquid asset on the balance sheet, and hence cash ratio indicates the percentage to which the cash present with the company covers the short obligations of the company. It is usually used for a company in distress.
#3 – Solvency Ratio
This type of important balance sheet ratios, i.e., Solvency ratio, measures a company’s ability to repay its debt obligations. In addition, it indicates whether the company is churning enough cash flow to meet its short-term and long-term debt obligation.
The types of Solvency Ratio are as follows,
Debt to Equity Ratio

The Debt to Equity Ratio is also called financial gearing. It indicates how much Equity is available to cover debt obligations.
Debt Service Coverage Ratio (DSCR)

DSCR Ratio indicates the ability of a company to repay its debt obligations.
DSCR = (Profit after tax + Depreciation + Interest) / (Interest Payments Or Principal Payments + Lease Payments)
Debt to Asset Ratio

Debt to Asset is used to analyze what portion of the firm’s assets are funded by debt. A high number indicates high financial leverage.
#4 – Profitability Ratios
These ratios are important balance sheet ratios measure the overall profitability of the business. The following are the types of Profitability Ratios.
Return on Asset

Return on assets measures the efficiency with which the company’s total assets can generate a net profit. A high ratio value indicates the efficient utilization of the company’s assets.
Return on Equity

Return on Equity is a measure of returns that the company is generating vis-à-vis the Equity invested in the firm.
Balance Sheet vs. Consolidated Balance Sheet Video Explanation

Recommended Articles
This has been a guide to what are Balance Sheet Ratio. We explain the concept along with its various types. You can learn more about accounting from the following articles –