Comparative Balance Sheet Meaning
The comparative balance sheet is a balance sheet that provides financial figures of assets, liabilities, and equities for “two or more periods of the same company,” or “two or more subsidiaries of the same company” or “two or more companies of the same industry” in the same format so that it can be easily understood and analyzed.
The comparative balance sheet has two amount columns against each balance sheet item. One column shows the current year’s financial position, whereas the other column shows the previous year’s financial situation. This helps investors or other stakeholders easily understand and analyze the company’s financial performance against last year.
Key Takeaways
- As the name suggests, comparative balance sheets are financial statements that show a company’s market position through two different periods, two subsidiaries of the same company, or two companies in the same industry over time and collate them.
- Doing a quick ratio analysis by using the firm’s data found on authoritative sources on the internet is an effective way to compare firms’ financial positions.
- Some advantages of comparing balance sheets are that comparative analysis helps in finding trends in the industry, it gets easier for the investors to forecast the future, and compare the performances of different companies over time.
- Comparative analysis also poses a few drawbacks, such as the inflationary effect surrounding the market isn’t considered, it sometimes can also be misleading, and thus, authentic information is absent.
Example Format of Comparative Balance Sheet
Below is the sample format of a comparative balance sheet.
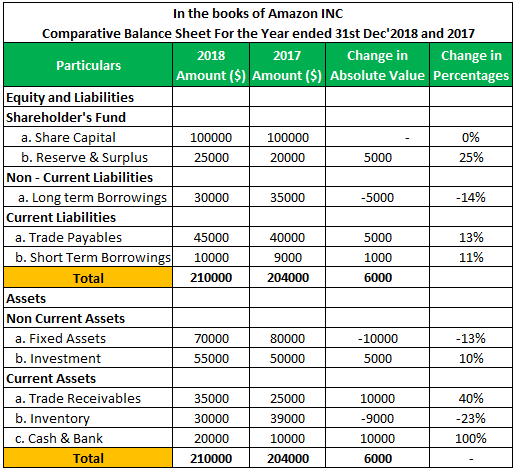
Below is the format of a comparative balance sheet of Amazon Inc. for 2018 and 2017. In this balance sheet, the financial position of the year ended 2018 and 2017 are mentioned in columns 2018 and 2017, respectively. There are two columns – the first column shows the change in absolute terms, and the second column leads the change in % terms.
| Current Ratio Analysis | 2018 | 2017 |
| Current Assets | 85000 | 74000 |
| Current Liabilities | 55000 | 49000 |
| Current Ratio | 1.5 | 1.5 |

After analyzing the above balance sheet, the below observations are made:
- The company’s share capital is the same for both years. It implies that the company has not issued any shares for the current year.
- The company’s reserve & surplus increased by $5,000, i.e., 25%. It exhibits that the company has earned profit and added reserve and surplus.
- Long-term borrowing reduced by $5,000, i.e., 14%, which indicates that the company has paid off a $5,000 loan.
- Fixed assets reduced by $10,000 because of depreciation.
- Inventory reduced by $9,000, and trade receivables increased by $10,000, which means the company has sold its stock to customers, while the amount is yet to be received.
- On analyzing the current ratio, we found it increased by $0.04 compared to last year, implying that the company has performed well in the current year compared to the previous year.
Note: – These are fundamental analyses with the help of a comparative balance sheet, which helps us understand its importance.
Similar to the analysis of balance sheet, other financial statements are also analyzed and different ratios are calculated for further analysis. If you want to explore more about how these ratios are calculated and analyzed, this Ratio Analysis Course can help you.
Balance Sheet Video Explanation

Advantages of Comparative Balance Sheet
- Comparison – It is effortless to compare the figures for the current year with the previous years as it gives both the years’ figures in one place. It also assists in analyzing the data of two or more companies or subsidiaries of one company.
- Trend Indicator – It shows the company’s trend by putting several years’ financial figures in one place like an Increase or Decrease in profit, current assets, current liabilities, loans, reserves & surplus, or any other items that help investors make the decision.
- Ratio Analysis – Financial ratio is derived from the balance sheet items. The comparative balance sheet’s financial ratio of two years of two companies can be derived to analyze the company’s financial status. For example, the current ratio is derived with the help of current assets and current liabilities. If the current ratio of the current year is more than the last year, it shows the company’s liabilities have been reduced from last year against the existing assets.
- Compare performance with the Industry Performance – Helps to compare one company’s performance with another company or the industry’s average performance.
- Helps in Forecasting – It also helps in forecasting because it provides the past trend of the company based on which the management can forecast the company’s financial position.
Limitation/Disadvantages
- Uniformity in Policy and Principles – Comparative balance sheets will not give the correct comparison if two companies have adopted different policies and accounting principles while preparing the balance sheet or if the same company has adopted other accounting methods in two additional years.
- Inflationary Effect is not Considered – While preparing the comparative balance sheet, the inflation effect is not considered. Therefore, only a comparison with other balance sheets will not give the correct picture of the company’s trend.
- Market Situation and Political Conditions not Considered – While preparing the comparative balance sheet, marketing conditions, political environment, or any factor affecting the company’s business are not considered. Therefore, it does not give the correct picture every time. For example, suppose the overall economy is going down in the current year, or the political condition is unstable compared to last year. In that case, it will decrease the demand, and general company sales will experience de-growth, not because of its performance but external factors.
- Misleading Information – Sometimes, it gives misleading information, thus, misguiding the person who reads the comparative balance sheet. For example, if a product was unavailable for last year and is available for the current year, it will show a 100% change over the previous year. It implies that one needs to read the complete financial statement, not just a comparative balance sheet.
Conclusion
A Comparative Balance Sheet is a balance sheet of “two or more years” or “two or more companies,” which helps investors and other stakeholders analyze the company’s performance and trend. It additionally assists them in making decisions and forecasting. At the same time, there are some limitations of this comparative balance sheet, like lack of uniformity in accounting practices. These inflationary factors need to be taken care of when analyzing the balance sheet.
Frequently Asked Questions (FAQs)
What is the purpose of comparative balance sheets?
The purpose of comparative balance sheets is to ascertain the company’s financial position and assets and liabilities. It creates a conclusive interpretation of how the company has performed in the previous financial year.
Are comparative balance sheets an accurate measure of a company’s performance?
No, a comparative balance sheet only works when the data is well put and presented. Balance sheets can be misleading; thus, they don’t provide an accurate picture of the company’s performance. Tools such as Total asset turnover and maintenance of cash reserves are indicators of a good company.
What is the difference between comparative balance sheets and common-size statements?
The absolute values of assets and liabilities are shown side by side in the comparative statement. In contrast, the proportion of each asset and liability based on the balance total is shown in the common size statement.
Recommended Articles
This article has been a guide to what is Comparative Balance Sheet and its meaning. Here we discuss its format and example along with its advantages and disadvantages. You can learn more from the following articles –