Part of our Banking Ratios & Metrics guide
What is the Annualized Rate of Return?
The annualized rate of return is a rate of return per year, when the return over a period, shorter or longer than one year, is annualized to facilitate comparison amongst annualized returns of the same or different asset classes.
In other words, an annualized rate of return is evaluated as an equivalent amount of annual return an investor is entitled to receive over a stipulated period. It is computed depending on time weight and scales down to 12 months, allowing investors to compare the return on assets over a particular time.
For example, assume that an asset returned 50% in three years and another has returned 85% in 5 years. With this data, it can be complex to understand which asset yielded better returns until we scale and determine which asset delivered a higher rate of return.
Key Takeaways
- The annualized rate of return is a measure used to represent the average annual growth rate of an investment over a specific period.
- It enables investors to compare the performance of different investments or evaluate the growth of their portfolio.
- The annualized rate of return considers the compounding effect of investment returns over time. It incorporates reinvesting earnings, dividends, and interest, more accurately representing the investment’s performance.
- Annualizing the rate of return is particularly beneficial when comparing investments with different holding periods. It allows investors to make meaningful comparisons on an annualized basis, normalizing the returns.
Formula
When the holding period is more than a year, it is calculated using the following formula:
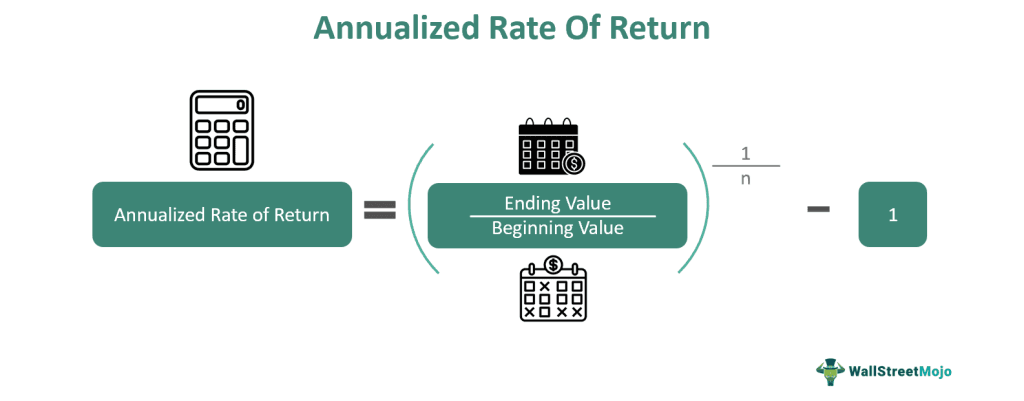
Annualized Rate of Return Formula = (Ending Value / Beginning Value)1/n – 1
When,
- Ending Value = Value of investment at the end of the period
- Beginning Value = Value of investment at the beginning of the period
- n = Number of years
In the above formula, 1/n can be substituted with 365/days for a precise calculation. Here, “days” is the number of days the investment was held.
If the investment is held for less than a year, the return can be calculated using the following formula:
ARR Formula = (Ending Value / Beginning Value)365/n – 1
When,
- n = Number of days one held the investment
Significantly, Global Investment Performance Standards (GIPS), a global body formulating performance reporting standards, recommends not to annualize performance for less than one year.
Examples of Annualized Rate of Return
Below are examples of this concept to understand it in a better manner:
You can download this Annualized Rate of Return Excel Template here – Annualized Rate of Return Excel Template
Example #1
Comparing returns for an investment period of more than a year.
Suppose the two investments with the same beginning value of $100,000 are redeemed in different periods. Investment 1 returned $150,000 in ending value in 3 years, while Investment 2 returned $185,000 in 5 years. The total returns for the holding periods were 50% and 85% for investments 1 and 2, respectively.
Solution:
Below is the given data for calculating the annualized rate of return:

Investment 1
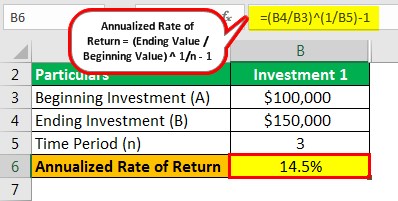
- = ($150,000/$100,000) ^ (1/3)-1
- =14.5%
Investment 2
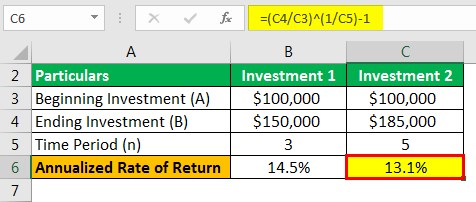
- = ($185,000/$100,000) ^ (1/5)-1
- =13.1%
An absolute comparison of returns will not be helpful because the holding period is not the same. Therefore, we need to calculate the rate of return for a meaningful comparison.
Then, we may quickly determine that Investment 1 has delivered better returns than Investment 2 on a like-to-like comparison of the two investments.
Example #2
Comparing returns for the investment period of less than a year.
When the holding period of investment is less than a year, it might not be reasonable to compare absolute returns because that does not examine the time these assets take to deliver the return.
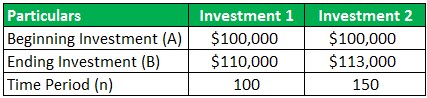
For example, Investment 1 and Investment 2 have the same beginning of $100,000. However, Investment 1 was held for 100 days and delivered a 10% return with an ending value of $110,000. Whereas, Investment 2 achieved an ending value of $113,000 in 150 days providing a 13% return on investment.
Solution: Below is given data for the calculation of the annualized rate of return.
Investment 1
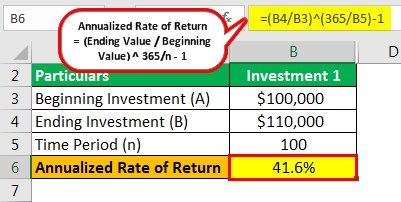
- = ($110,000/$100,000) ^ (365/100)-1
- =41.6%
Investment 2

- = ($113,000/$100,000) ^ (365/150)-1
- = 34.6%
At first sight, 13% of Investment 2 looks like a greater return than 10% of Investment 1. However, we may get different results if we rightly compare the returns of the two investments.
It is evident from the calculations above that after annualizing the returns for both these investments. Investment 1 outpaces Investment 2 by a good margin, not before evaluating the annualized return.
Practically, annualized returns for a holding period of less than a year are not considered the right performance barometer for several reasons. Firstly, the investment horizon of less than a year is too less for an investor to consider thoughtfully. Secondly, extrapolating returns for a shorter period explains that the investment might have earned an equivalent return for the whole period, which might not hold correctly in most cases. Lastly, annualized short-term returns are forecasted returns, not actual returns.
Conclusion
The annualized rate of return comes in handy while comparing and ranking returns. As absolute returns can be deceptive, it enables clarity on the return profile of the investments. However, the significant advantage is that it informs the investor of a compounded annual rate of return, considering that they have reinvested earnings from the acquisition at the same rate. Therefore, it can also be termed the compounded annual return rate.
Frequently Asked Questions (FAQs)
How does the annualized return rate differ from the simple rate of return?
The simple rate of return calculates the total percentage gain or loss on an investment without considering the period. It is a straightforward calculation of the difference between the initial and final value of the investment. In contrast, the annualized rate of return considers the compounding effect and calculates the average rate of return per year over a specific period.
Can the annualized rate of return be negative?
Yes, the annualized rate of return can be negative. It is possible for an investment to experience an overall loss over a specific period, resulting in a negative annualized rate of return.
What are the limitations of using the annualized rate of return?
The annualized rate of return has several limitations. Firstly, it assumes a constant rate of return, which may not accurately capture the actual volatility and fluctuations in investment returns. Additionally, it does not consider the timing or sequence of returns, potentially leading to different investment outcomes even with the same annualized rate. Finally, external factors such as taxes, inflation, and transaction costs are also disregarded, which can impact the actual returns earned by investors.
Recommended Articles
This article is a guide to Annualized Rate of Return and its meaning. Here, we discuss the annualized rate of return formula and calculations with examples. You may learn more from the following articles: –