What is the Geometric Mean Return?
The geometric mean return calculates the average return for the investments which are compounded on the basis of its frequency depending on the time period and it is used to analyze the performance of investment as it indicates the return from an investment.
Key Takeaways
- Geometric mean return reflects compounded growth rate over multiple periods, accounting for compounding in long-term investments.
- It provides a more accurate measure of investment performance than the arithmetic mean, especially with fluctuating or volatile investments.
- When comparing options, consider geometric mean return alongside risk, volatility, and goals. A higher geometric mean return doesn’t guarantee better performance if associated with higher risk.
- Valuable for long-term investors, assessing consistency and stability of returns, providing a realistic growth expectation.
Geometric Mean Return Formula
- r = rate of return
- n = number of periods
It is the average set of products technically defined as the ‘n’ th root products of the expected number of periods. The focus of the calculation is to present an ‘apple to apple comparison’ when looking at 2 similar kinds of investment options.
Examples
Let us understand the formula with the help of an example:
Assuming the return from $1,000 in a money market that earns 10% in the first year, 6% in the second year, and 5% in the third year, the Geometric mean return will be:
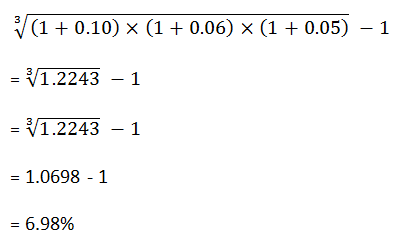
This is the average return taking into consideration the compounding effect. If it had been a Simple average return, it would have taken the summation of the given interest rates and divided it by 3.
Thus to arrive at the value of $1,000 after 3 years, the return will be taken at 6.98% every year.
Year 1
- Interest = $1,000 * 6.98% = $69.80
- Principal = $1,000 + $69.80 = $1,069.80
Year 2
- Interest = $1,069.80 * 6.98% = $74.67
- Principal = $1,069.80 + $74.67 = $1,144.47
Year 3
- Interest = $1,144.47 * 6.98% = $79.88
- Principal = $1,144.47 + $79.88 = $1,224.35
- Thus, the final amount after 3 years will be $1,224.35, which will be equal to compounding the principal amount using the three individual interests compounded on a yearly basis.
Let us consider another instance for comparison:
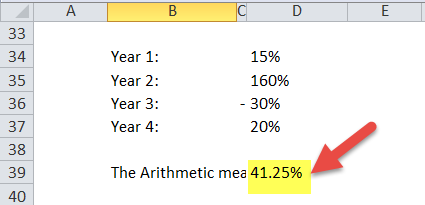
An investor is holding a stock which has been volatile with returns significantly varying from one year to another. The initial investment was $100 in stock A, and it returned the following:
Year 1: 15%
Year 2: 160%
Year 3: -30%
Year 4: 20%
- The Arithmetic mean will be = [15 + 160 – 30 + 20] / 4 = 165/4 = 41.25%
However, the true return will be:
- Year 1 = $100 * 15% [1.15] = $15 = 100+15 = $115
- Year 2 = $115 * 160% [2.60] = $184 = 115+184 = $299
- Year 3 = $299 * -30% [0.70] = $89.70 = 299 – 89.70 = $209.30
- Year 4 = $209.30 * 20% [1.20] = $41.86 = 209.30 + 41.86 = $251.16
The resultant geometric mean, in this case, will be 25.90%. This is much lower than the Arithmetic mean of 41.25%
The issue with Arithmetic mean is that it tends to overstate the actual average return by a significant amount. In the above example, it was observed that in the second xyear the returns had risen by 160% and then fell by 30% which is year over year variance by 190%.
Thus, Arithmetic mean is easy to use and calculate and can be useful when trying to find the average for various components. However, it is an inappropriate metric to use for determining the actual average return on investment. The geometric mean is highly useful for measuring the performance of a portfolio.
Uses
The uses and benefits of the Geometric Mean Return formula are:
- This return is specifically used for investments that are compounded. A simple interest account will make use of the Arithmetic average for simplification.
- It can be used for breaking down the effective rate per holding period return.
- It is used for Present value and future value cash flow formulas.
Geometric Mean Return Formula in Excel (with excel template)
Let us now do the same example above in Excel. This is very simple. You need to provide the two inputs of Rate of Numbers and Number of Periods.
You can easily calculate the Geometric Mean in the template provided.

Thus to arrive at the value of $1,000 after 3 years, the return will be taken at 6.98% every year.

Thus, the final amount after 3 years will be $1,224.35, which will be equal to compounding the principal amount using the 3 individual interests compounded on a yearly basis.
Let us consider another instance for comparison:
However, the true return will be:

The resultant geometric mean, in this case, will be 25.90%. This is much lower than the Arithmetic mean of 41.25%
Frequently Asked Questions (FAQs)
1. What is geometric mean return vs. harmonic mean return?
Geometric mean return measures investment performance considering the compounded growth rate over multiple periods. It considers the effect of compounding and is particularly relevant for long-term investments where returns are reinvested. On the other hand, harmonic mean return is a measure that calculates the average rate of return based on the reciprocals of individual returns.
2. What are the limitations of geometric mean application?
The limitations of geometric mean application include its sensitivity to extreme values or outliers in the data. Since geometric mean involves multiplication, even a single extreme value can significantly impact the calculated result. Additionally, the geometric mean does not provide information on the variability or dispersion of returns, which may be important factors to consider in investment analysis.
3. Is the geometric mean return affected by outliers or extreme values?
No, outliers or extreme values do not affect the geometric mean return. Unlike other measures, such as the arithmetic mean, the geometric mean is less influenced by extreme values because it involves multiplying individual returns. This property makes it a more robust measure of average growth rate over time, especially in the presence of outliers.
Recommended Articles
This article has been a guide to Geometric Mean and its definition. Here we discuss the formula of Geometric Mean Return along with examples and excel templates. You may also have a look at these articles below to learn more about Corporate Finance.