Table of Contents
What Is K-Ratio?
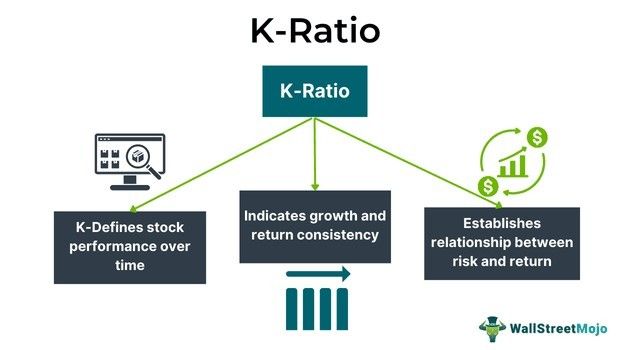
K-ratio determines a stock's return growth and consistency of offering returns over time. The ratio uses the value-added monthly index, which depends on its data on a linear regression that analyzes the growth of $1000 as an initial investment in the underlying security.

The ratio is the division of the regression line and standard error slope, which in finance is further used as a tool to measure long-term stock growth concerning time. The higher the K ratio, the better performance and growth consistency are observed in the stock. The ratio is also called zephyr k-ratio.
Key Takeaways
- K-ratio is a statistical measure of a security's return consistency and performance over time.
- It was developed by Lars Kestner in 1996, a prominent author who wrote several books on trading, finance and investment.
- It was developed by Lars Kestner in 1996, a prominent author who wrote several books on trading, finance and investment.
- K-ratio has multiple uses in finance including the analysis of stock performance, bond market and asset types.
K-Ratio Explained
K-ratio establishes the relation between the return and risk of an underlying stock to determine its growth consistency and return performance over time. In his book Quantitative Trading Strategies, Lars Kestner, a derivative trader and statistician, developed and introduced the ratio. A linear regression derives the ratio by generating a scatter plot of log(VAMI) verses. The slope concerning time is measured; the deviation points from the regression line are gauged with the help of a standard error.
Kestner made many small changes to the ratio In the following years like adjustment factors for various types of return observations and various return periods. The K-ratio is directly proportional to the slope; when the slope increases, the K-ratio increases, and when outsized gains decrease, the K-ratio declines.
Kestner first revised the ratio concept in 2003 and changed the formula, then again in 2013, adjusted it by including a square root calculation in the numerator part. It is often advised that the ratio be used with other ratios and indicators to reach a better and more accurate value and understanding of the stock. Kestner initially introduced the ratio as an alternative to the Sharpe ratio, which measures risk-adjusted return for any particular stock. The whole calculation is based on the data of the underlying stock; the bigger the data will be, the more accurately the value of the K-ratio will be deduced. The K-ratio is not restricted to stocks alone but can be used for analyzing other assets, trading strategies and fund managers.
Uses in Finance
K-ratio is used in finance for -
- The ratio represents a quantitative value for the stock's return over time.
- Financial analysts study the k-ratio to gauge the performance of stocks.
- It can be used as a statistical tool to study bond markets and individual asset types.
- The k-ratio is employed to compare the returns and consistency of different equities in the market. At the same time, the ratio is collated with other technical indicators for in-depth analysis.
- It takes account of the return trend and the risk factor from the investment.
- In general, the viability of an investment is gauged with the help of K-ratio.
How To Calculate?
K-ratio formula = slope (LogVAMI Regression Line)/n(Standard error of slope)
Here,
n = return periods in the monthly return data
Examples
Check out these examples for a better idea:
Example #1
The determination of the k-ratio is based on the VAMI index and linear regression and marks the standard error of the slope. Suppose a derivative statistician pursues a particular stock in the exchange and collects its historical data with price movements and trend patterns.
The slope (LogVAMI regression line) is 29, and n(standard error of slope) is 7
Therefore 29/7 = 4.14
The value-added monthly index derives the K-ratio value is 4.14
Generally, the underlying security pursued by the statistician has consistent growth and, over time, has produced good returns to its investors. In contrast, if the value had come below 2, it would indicate a static and poor return consistency, a serious concern in financial analysis.
The formula for K-ratio implies both slope and standard error; the former implies the accounts for return, and the latter accounts for risk. Therefore, the value can be understood as a return-to-risk ratio.
Example #2
As per a 2010 Forbes article, the K-ratio of gold showed astonishing results and indicated growth. The varying values of the K-ratio for gold showcase its tendency to move both upside and downside every time the gold bullion makes a move. The data comprises the last 35 years of weekly K-ratio values for gold stocks and measured their performance for 13, 26 and 52 weeks.
The data also shows how the buy when cheap and sell when the expensive theory was still practical. When the K ratio showed a value of 2.141, the gold stocks were only higher than the previous year. At the same time, when the value of the K-ratio was 1.13, the gold stocks increased by 70.7%.
