What Is the Gross Profit Ratio?
The gross profit ratio is a profitability measure calculated as the gross profit (GP) ratio to net sales. It shows how much profit the company generates after deducting its cost of revenues. It is a percentage of revenue that exceeds the cost of goods sold.
Thus, it is a measure of the efficiency of the production process, which indicates how well the company manages the cost and the margin that is available to meet all the operating expenses. It does not consider the selling, general or administrative expenses. Thus, it gives us a good idea about the gross profit efficiency but does not provide a complete profitability view.
Key Takeaways
- The gross profit ratio is a profitability metric calculated by dividing the gross profit (GP) by net sales. It represents the profit generated by a company after deducting the cost of goods sold.
- To calculate the gross profit ratio, you need to gather information on total sales, sales returns, opening stock, purchases, purchase returns, closing stock, and direct expenses.
- The gross profit ratio showcases the relationship between a company’s gross profit and net sales, indicating the portion of net sales that represents its gross profit.
Gross Profit Ratio Explained
The gross profit ratio is also known as the gross profit margin which tells us how much percentage of revenue is more compared to the cost of goods sold. Thus, before taking into account the operational expenses, the metric measures the effectiveness of the production process.
It is useful to the management and creditors, shareholders and investors to calculate gross profit ratio because it allows the company to compare itself with the competitors and peers in the market. The higher the raio, the better is the company’s ability to control cost. Thus, it indicates the skill and competence of the management.
It also shows the ability of the business to cover other operating expenses. Since it indicates the proficiency of the ccompany, it is widely used by the management to forecast the prices and design pricing strategy for increasing sales and revenue while at the same time remaining in the competition by charging a reasonable price.
It is important for the company to calculate gross profit ratio and monitor the ratio over time so that it is possible to note the changes. The changes in the ratio will highlight the trends and fluctuations that should be taken into account and accordingly adjust the production and operational process to achieve the maximum profit through cost control.
Formula
Let us see how to calculate Gross Profit.
Gross Profit = Net Sales – Cost of Goods Sold
To obtain gross profit using the above equation, we need to find two other values, i.e., net sales and cost of goods sold.
First, let us look into the value of ‘net sales.’
Net Sales = Sales – Return Inwards
The next value we need to obtain is the ‘cost of goods sold.’
Cost of Goods Sold = Opening Stock + Purchases*- Closing Stock + Any Direct Expenses Incurred
*Purchases imply net purchases, i.e., purchases minus purchase returns.
After obtaining all the above values, we can now compute the ideal gross profit ratio as follows: –
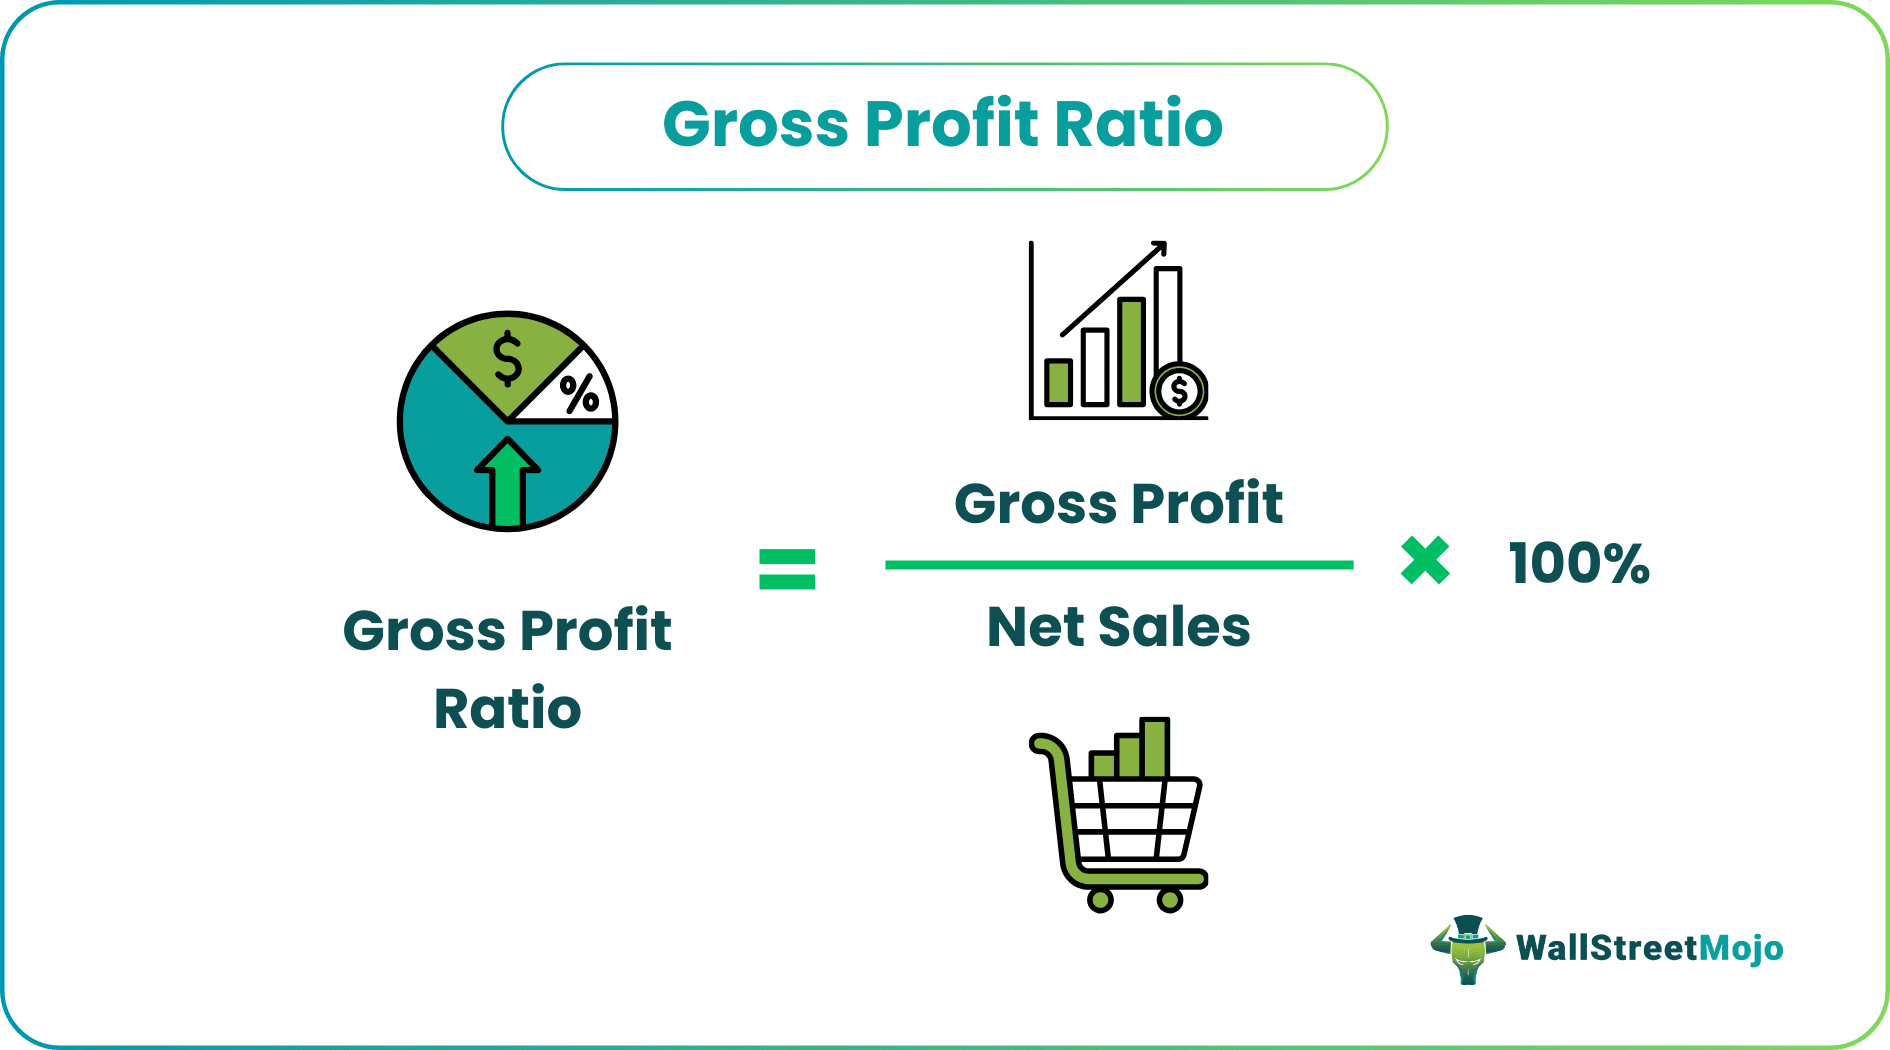
Gross Profit Ratio Formula = (Gross Profit/Net Sales) X 100
(Usually expressed in the form of a percentage)
From the above computations, we can say that we require the following values to obtain the ideal gross profit ratio: –
- Total Sales
- Sales Returns (If any)
- Opening Stock of Goods
- Purchases made during the period
- Purchase Returns (If any)
- Closing stock, i.e., inventory at the end of the period for computing the ratio
- Direct Expenses Incurred.
As we can see, one can pick up all these amounts from the trading account.
Examples
Let us understand the calculation of the gross profit ratio with the help of an example: –
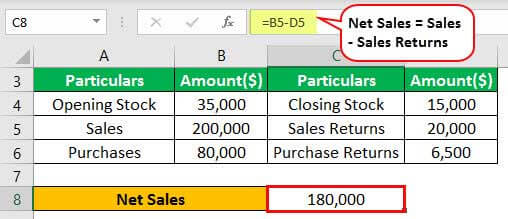
| Particulars | Amount ($) | Particulars | Amount ($) |
|---|---|---|---|
| Opening stock | 35,000 | Closing Stock | 15,000 |
| Sales | 200,000 | Sales Returns | 20,000 |
| Purchase | 80,000 | Purchase Returns | 6,500 |
#1 – Net Sales
#2 – Cost of Goods Sold (COGS)

#3 – Gross Profit
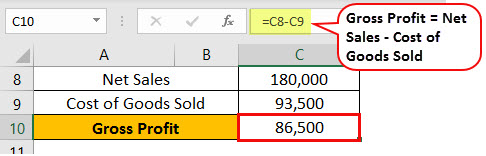
Finally,
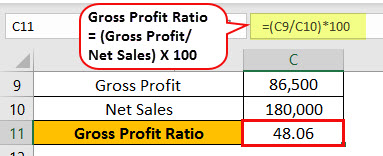
#4 – Gross Profit Ratio Formula
Let us now move on to the significance and implications of the gross profit ratio.
Importance
Let us try to identify the importance of the financial concept of gross profit ratio analysis in detail.
- By comparing net sales with the company’s gross profit, the gross profit ratio will enable the users to know the profit margin that the company is earning from the trading and manufacturing activity.
- Gross profit ratio analysis determines how much the company makes more than the amount it has to pay for its operating expenses.
- It helps in inter-firm comparison of the results of trading activity.
- Gross profit tells how a company is doing better or worse than its competitors because the higher the efficiency, the higher the gross profit.
- It determines the edge the company has in the market.
- Comparing the gross profit ratio trend over the years helps define the company’s growth rate.
- This margin allows for creating budgets and forecasts.
Limitations
The concept of good gross profit ratio also has some important limitations that should be noted carefully. Let us examine them.
- It does not consider the company’s expenses usually charged to the profit and loss account.
- It is only a passive indicator of the company’s overall status. For example, a company may have a positive gross profit margin. Still, when all other expenses reduce, the resultant profit might be quite less, or sometimes, the company may be running in losses. So, the gross profit percentage is not a metric on which the entire profitability of the company can be measured or judged.
Interpretation
If the analysis of the gross profit trend indicates an increase in the percentage, we can arrive at any of the following conclusions: –
- The opening stock is understated, or the value of the closing stock is overstated.
- There is an increase in the selling price of the goods without a corresponding increase in the cost of goods sold.
- Similarly, there is a decrease in the cost of goods sold without a corresponding reduction in the selling price.
- There must have been errors while recording the purchases or sales figures. For example, the buys might have been omitted, or sales figures might have been recorded more than the actual sales, i.e., boosted.
Suppose the gross profit trend analysis indicates a decrease in the percentage. In that case, we can arrive at any of the following conclusions: –
- The value of the opening stock is overstated, or the value of the closing stock is understated.
- There is a decrease in the selling price of the goods without a corresponding reduction in the cost of goods sold.
- Similarly, there is an increase in the cost of goods sold without a corresponding increase in the selling price of the goods.
- There must have been errors while recording the purchases or sales figures. For example, sales might have been omitted, or purchase figures might have been recorded more than the actual sales, i.e., boosted.
In short, Gross Profit (GP) ratio is a measure that shows the relationship between the gross profit earned by an entity and the company’s net sales in a manner that what portion of the net sales is achieved as the company’s gross profit. Though it is a popular and widely used tool for evaluating the operational performance of the business, it is not a complete measure for judging the company’s overall functioning. The net profit ratio would be more useful because it considers all other expenses, which we shall learn about in another article.
Gross Profit Ratio Vs Net Profit Ratio
Both the above concepts are important financial metrics that give a very precise idea about the financial condition of the company. However, there are some points of differences between them as follows:
- The good gross profit ratio measures the company’s efficiency level regarding production or purchasing process for the purpose of profit generation but the latter refers to the part of an unit of dollar that remains as profit in the business.
- The former indicates how efficiently the company is able to manage the cost of production and purchasing processwhereas the latter indicates the overall profitability of the business after taking into account all the expenses that it incurs for running the business operation.
- As derived from the above points, the former takes into account the relation between the gross profit and net sales only without considering the operating expense, whereas the latter accounts for all expenses including operating expense, tax, interest, etc.
- If the former is high, it reflects that the company is able to manage the production cost of the business efficiently. If the latter is high, it indicates that the profit earning capacity of the company is high with respect to the sales made.
Thus both are very good measures of the company’s financial condition which is useful not only for the management but also for the stakeholders who use this information to take investment decisions.
Frequently Asked Questions (FAQs)
What are the applications of the gross profit ratio?
The gross profit ratio has several applications. It helps assess a company’s profitability and cost management, aids in pricing decisions, allows for industry and competitor comparisons, assists in financial analysis, and provides insights into the efficiency of a company’s production and sales processes.
How to determine an ideal gross profit ratio?
The ideal gross profit ratio varies across industries and depends on factors such as market conditions, competition, and business models. It is crucial to compare the gross profit ratio within the same industry or use industry benchmarks to determine what is considered favorable for a particular business.
What is the gross profit ratio vs. net profit ratio?
The gross profit ratio measures a company’s profitability by comparing its gross profit to net sales. It reflects the portion of net sales that constitutes gross profit. In contrast, the net profit ratio measures a company’s overall profitability by comparing its net profit to net sales. It takes into account all expenses, including operating costs, taxes, interest, and other factors, to assess the company’s profitability after all deductions.
Recommended Articles
This article is a guide to what is Gross Profit Ratio. We explain the formula, interpretation, example, importance & differences with net profit margin. You can learn more about accounting from the following articles: –