What Is The Profit Margin Formula?
The profit margin formula measures the company’s amount earned (earnings) concerning each dollar of the sales generated. In short, the profit margin provides an understanding of the percentage of sales, which is left after the company has paid the expenses.
There are three important profit margin metrics: gross profit margin, operating profit margin, and net profit margin. It is one of the significant ratios of the company as every investor or potential investor uses this ratio to know the company’s financial position.
Key Takeaways
- The profit margin formula calculates the amount of earnings a company generates per dollar of sales. It represents the percentage of sales remaining after deducting expenses.
- Gross profit margin, operating profit margin, and net profit margin are key metrics used to assess profit margin.
- Creditors, investors, and stakeholders utilize these ratios to evaluate how effectively a company converts its sales into income.
- Management relies on these ratios to monitor and improve the company’s operational performance.
Profit Margin Formula Explained
The profit margin formula helps calculate a business’s earnings with respect to the sales generated per dollar. When it comes to this profit margin calculation, there are three forms of ratios that businesses obtain – gross profit margin, operating profit margin, and net profit margin. As soon as these ratios are generated, it helps internal and external stakeholders of businesses to make well-informed strategic decisions, including investment decisions.
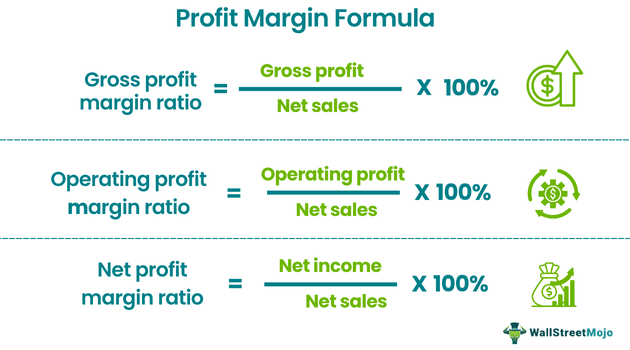
The profit margin ratio can be calculated as: –
Gross Margin Formula = Gross Profit / Net Sales x 100
- The gross profit margin formula is derived by deducting the cost of goods sold from the total revenue.
Operating Margin Ratio = Operating Profit / Net Sales x 100
- Operating profit is derived by deducting all costs of goods sold, depreciation and amortization during the period, and other relevant expenses from the total revenue.
Net Margin Ratio = Net Income / Net Sales x 100
- Net income is derived by deducting total expenses from the total revenues. Therefore, it is usually the last number reported in the income statement.
- Net sales are calculated by deducting any returns from the number of gross sales.
Interpretation
#1 – Gross Profit
It is one of the simplest profitability ratios as it defines the profit as all the income that remains after deducting only the Cost of the Goods Sold (COGS). Moreover, the cost of the goods sold includes those expenses only associated with the production or manufacturing of the selling items directly, like raw materials and the labor wages required for assembling or making the goods.
This figure does not consider expenses for debt, overhead costs, taxes, etc. This ratio compares the gross profit earned by the company to the total revenue, which reflects the percentage of income retained as the profit after the company pays for the cost of production.
#2 – Operating Profit
It is a slightly complex metric compared with the gross profit ratio formula as it considers all the overhead required for running the business like administrative, operating, and sales expenses. This figure, however, excludes non-operational expenditures like debt, taxes, etc., but at the same time, it does include depreciation and amortization costs related to assets.
The mid-level profitability ratio reflects the percentage of revenue retained as the profit after a company pays for the cost of production and all the overhead required for running the business. This ratio also helps indirectly determine whether the company can manage its expenses well or not relative to the net sales. Because of this, the company tries to achieve a higher operating ratio.
#3 – Net Profit
This ratio reflects total residual income, which is left after deducted all non-operating expenses from the operating profit, such as debt and unusual one-time expenditures. All the additional income generated from operations, which are not the primary operations like a receipt from the sale of assets, is added.
These ratios are best used to compare similar companies in the same industry. Also, these ratios are effectively used for measuring the company’s past performance.
Calculation Examples
Let us check some simple examples to check how to calculate the earnings of a business using the profit margin formula in Excel:
Example #1
For the accounting year ending on December 31, 2019, X Ltd. has a revenue of $2,000,000. The gross and company operating profit are $1,200,000 and $400,000, respectively. Therefore, the net profit for the year came to $200,000. Calculate the profit margins using the profit margin formula.
Solution:
Use the following data for the calculation of profit margin: –
- Net Sales: $2,000,000
- Gross Profit: $1,200,000
- Operating Profit: $400,000
- Net Profit: $200,000
Gross Profit Margin Ratio
Gross margin can be calculated using the above formula as: –

- Gross Margin = $ 1,200,000 / $ 2,000,000 x 100
Gross Profit Margin Ratio will be: –

- Gross Profit Margin Ratio = 60%.
Operating Profit Margin Ratio Formula
Operating margin can be calculated using the above formula as: –
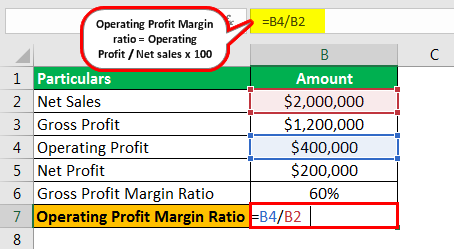
- Operating Profit Margin Ratio = $ 400,000 / $ 2,000,000 x 100
Operating Profit Margin Ratio will be:-

- Operating Profit Margin Ratio = 20%.
Net Profit Margin Ratio
Net margin can be calculated using the above formula as: –

- Net Profit Margin Ratio = $200,000 / $2,000,000 x 100
Net Profit Margin Ratio will be: –
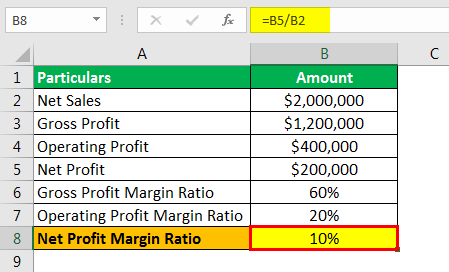
- Net Profit Margin Ratio = 10%
The above ratios show strong gross, operating, and net profit margins. The healthy profit margins in the above example enabled X Ltd. to maintain decent profits while meeting all its financial obligations.
Example #2
Y Co. has the following transaction for December 31, 2018. Calculate the profit margin.
Use the following data for the calculation of the profit margin:-
- Revenue: $500,000
- Cost of Goods Sold: $300,000
- Sales, Marketing & Advertising Expenses: $55,000
- General Administrative Expenses: $45,000
- Depreciation: $10,000
- Interest: $15,000
- Taxes: $10,000
Solution:
Gross Profit Margin Ratio

- Gross Profit Margin Ratio = $200,000 / $500,000 x 100
The gross ratio will be: –

- Gross Profit Margin Ratio = 40%.
Operating Profit Margin Ratio

- Operating Profit Margin Ratio = $90,000 / $500,000 x 100
The same reflected in Excel looks like this:-

- Operating Profit Margin Ratio = 18%.
Net Profit Margin Ratio

- Net Profit Margin Ratio = $65,000 / $500,000 x 100
When reflected in Excel, it looks like this:

- The net ratio = 13%.
The above example shows that Y Ltd. has positive gross, operating, and net profit margins and can thus meet all its expenses.
Relevance & Uses
Creditors, investors, and other stakeholders use these ratios to measure how effectively a company can convert its sales into income. Investors of the company want to ensure that the profits earned by the company are high enough so that one can distribute dividends to them. The management uses these ratios to ensure the company’s workings, i.e., profits, are high enough to ensure the correct working of the company’s operations. Creditors need to be sure that the company’s profits are high enough to pay back their loans. So, all the stakeholders want to know that the company is working efficiently. If the profit margins are extremely low, the company’s expenses are too high compared to sales, and the management should budget and reduce the costs.
Frequently Asked Questions (FAQs)
What are the limitations of the profit margin formula?
The profit margin formula, while useful, has certain limitations. It does not consider other financial aspects, such as overhead costs, taxes, and interest expenses, which can significantly impact overall profitability. Additionally, comparing profit margins across industries or companies of different sizes may not provide an accurate benchmark due to variations in cost structures and business models.
What is a good profit margin?
A good profit margin varies depending on the industry and business. Generally, a higher profit margin indicates better financial performance and efficiency. However, a good profit margin can differ significantly across sectors. It is essential to compare profit margins within the same industry or use industry-specific benchmarks to determine what is considered favorable for a particular business.
What is profit margin vs. profit percentage?
Profit margin and profit percentage refer to the same concept and are often used interchangeably. Both terms represent the ratio of net profit to revenue or sales. Profit margin is typically expressed as a percentage, representing the portion of each dollar of revenue that translates into profit. It serves as an indicator of a company’s profitability and efficiency in converting sales into profit.
Recommended Articles
This article is a guide to what is the Profit Margin Formula. Here we explain it with examples to show how to calculate it using an Excel template. You can learn more about financial analysis from the following articles: –