Part of our Excel Charts guide
Stacked Bar Chart in Excel
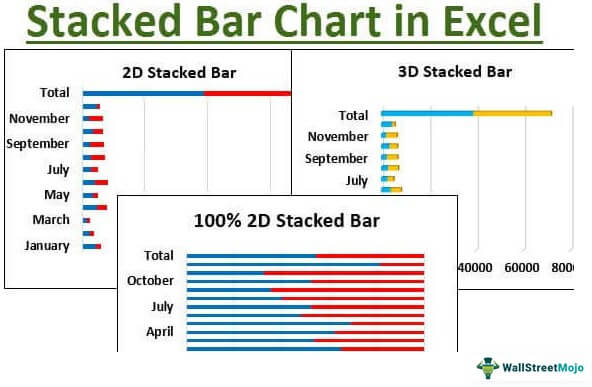
The stacked bar chart in Excel helps represent data in bars, which facilitates comparison between data values. Every vertical bar consists of different segments (elements or sub) which are stacked over one another. These segments are the components that make the bar.
A stacked bar chart allows users to compare the segments of different categories. The data in a stacked bar chart can be represented in horizontal and vertical bars. In the horizontal chart, the data segments are adjacent to each other, while in the vertical chart, the data segments are in the form of stacked bars.
Every bar on the chart is divided into sub-segments (or sub-elements) that represent the whole data in different parts. Each sub-segment is colored the same. This helps differentiate between the whole chart and the segments.
Key Takeaways
- The stacked bar chart in excel helps represent data in the form of bars to facilitate a comparison between data values.
- The stacked bar chart helps study the impact of the changes in each segment on the total value across categories.
- Every bar consists of different segments (or elements) which are components that make the bar.
- In the horizontal stacked bar chart, the data segments are adjacent to each other.
- In the vertical stacked bar chart, the data segments are stacked over one another.
- It is not preferable to use stacked bar charts with large data sets that require in-depth data analysis.
How to Create a Stacked Bar Chart in Excel?
In Excel, there are multiple chart options like 2-D bars, 2-D 100% stacked bars, 3-D bars, 3-D 100% stacked bars, and so on.
Let us consider the following examples to create the stacked bar chart in Excel.
Example #1–The 2D Stacked Bar Chart
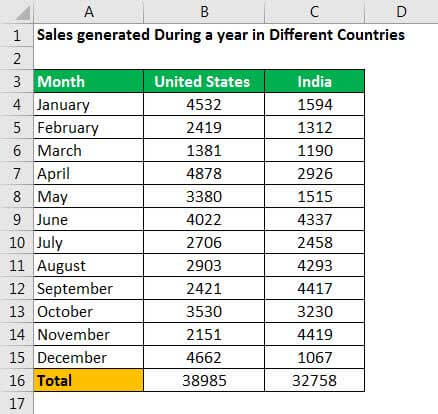
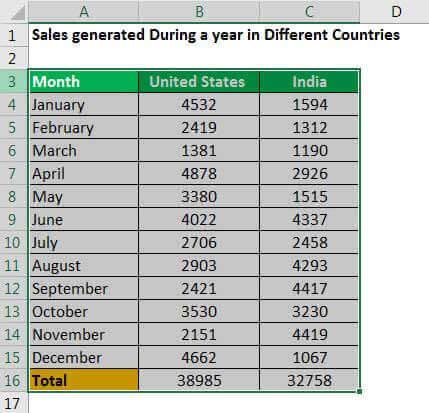
We have the monthly sales revenue generated by two countries–the United States of America and India. We want to create a 2-D stacked bar chart.
Time needed: 3 minutes.
The steps to create a 2-D stacked bar chart are listed as follows:
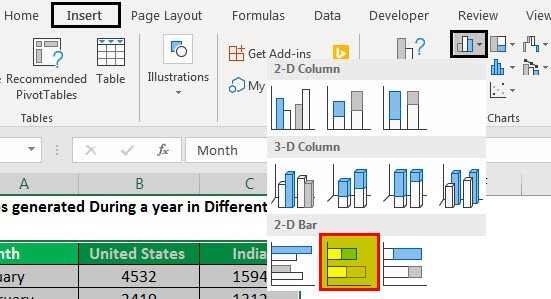
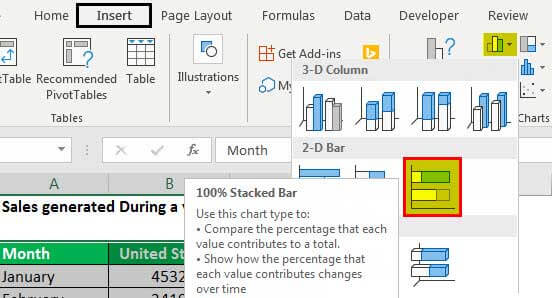
Select the data that you want to display in the form of a chart.

In the Insert tab, click Column Charts (in Charts section) and select “2-D stacked bar.”

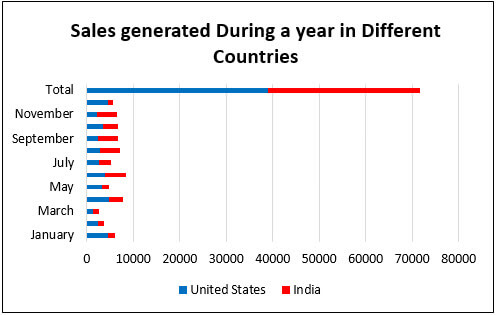
A chart appears, as shown in the following image. The stacked bar chart compares the sales revenue generated in different months with respect to time.

Once the stacked bar chart is inserted, the Design and Format tabs appear on the Excel ribbon. These tabs help change the chart appearance, layout, styles, and so on.

It is also possible to switch the row or column, insert and format a shape, etc., as shown in the succeeding image.

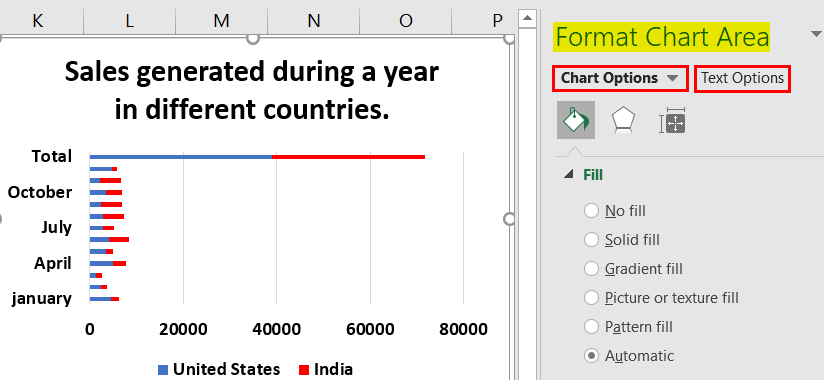
The different formatting options, as shown in the following screenshot, help enhance data visualization.
To format the chart, click “chart options” and “text options” under the “format chart area.”


Example #2–The 100% 2D Stacked Bar Chart
Let us consider the data of the previous example again. The steps to create a 100% 2-D stacked bar chart are listed as follows:
- Step 1: In the Insert tab, click Column Charts (in Charts section) and select “100% 2-D stacked bar.”
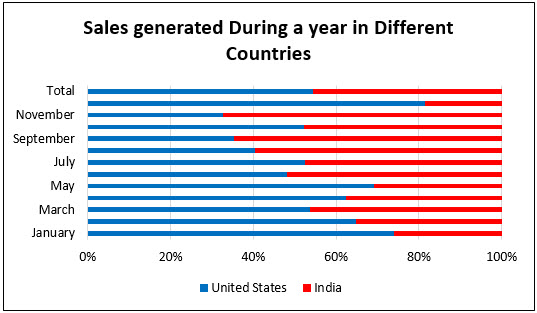
- Step 2: The chart appears, as shown in the following image. The percentages are displayed on the x-axis (horizontal) and the months are displayed on the y-axis (vertical).
The 100% stacked bar chart shows the percentage sales of both the countries (out of total sales) from 2015 to 2018. The bars are colored contrastingly to differentiate the USA from India.
The bars representing sales of the USA are in blue while those of India are in orange. The 100% stacked bar chart allows a comparison of the total sales generated by both the countries.
Example #3–The 3-D Stacked Bar Chart
Let us consider the data of the previous example again. The steps to create a 3-D stacked bar chart are listed as follows:
- Step 1: Select the data to create a chart.

- Step 2: In the Insert tab, click Column Charts (in Charts section) and select “3-D stacked bar.”
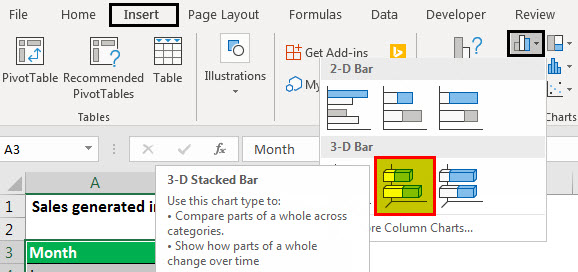
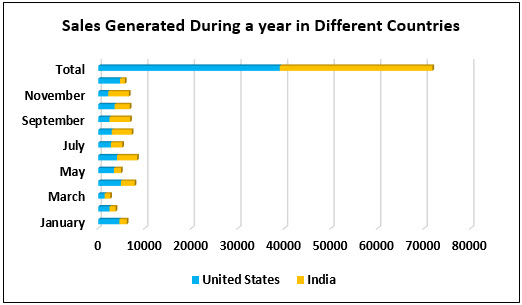
- Step 3: The chart appears, as shown in the following image.
Example #4–The 100% 3-D Stacked Bar Chart
Let us consider the data of the previous example again. The steps to create a 100% 3-D stacked bar chart are listed as follows:
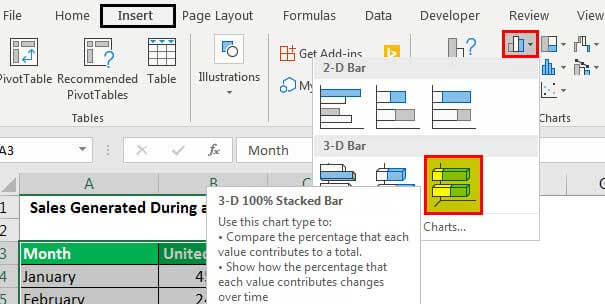
- Step 1: In the Insert tab, click Column Charts (in Charts section) and select “100% 3-D stacked bar.”
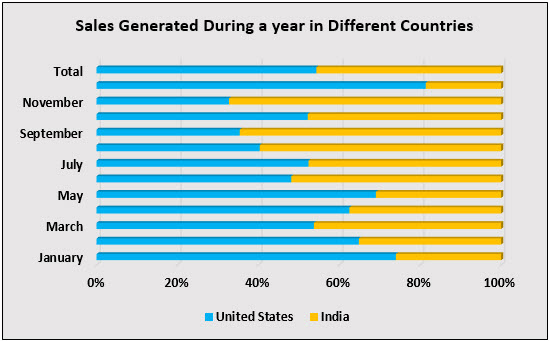
- Step 2: The chart appears, as shown in the following image.
The results of example #2 and example #4 are the same. This is because the 3-D formatting only changes the appearance of the chart.
Relevance and Uses
The stacked bar charts are created to help the users compare the different segments simultaneously. The impact of the changes in each segment on the total value across categories can also be observed.
The scenarios in which the stacked bar chart can be used are listed as follows:
- Comparison: It allows easy comparisons of data. The data provided relates to production, sales, profits, and so on.
- Ranking: It shows the rankings across time periods. This is done by using different colors for different length of the bars.
- Survey result: It helps analyze the results of a survey. This is done by highlighting the key aspects and differentiating the data values.
- Part-to-whole differentiation: It differentiates every part of data from the whole part. This is done to show the focus area of the chart.
The scenarios in which the stacked bar chart should not be used are listed as follows:
- Large data sets: It is not preferable to use stacked bar charts with a large amount of data. This is because the chart becomes complicated, which makes it challenging to analyze.
- In-depth analysis: It is not suitable for long-term decision-making. This is because conducting an in-depth analysis of the data is difficult with a stacked bar chart.
The Guidelines to Use Stacked Bar Chart in Excel
The guidelines for proper usage of a stacked bar chart are stated as follows:
- It is enhanced visually by adding the trend line, title, legend, data label, and so on.
- It is formatted by right-clicking the bar and choosing the required specifications.
- It is given a title to make it easy for the user to understand the data it is representing.
- It does not return different results when a 2-D or 3-D version is applied to the same data.
- It is not applicable when the number of segments is large and a comparison between them is involved.
Frequently Asked Questions (FAQs)
What is a stacked bar chart in Excel?
A stacked bar chart shows different numeric values across multiple data categories. Every bar is divided into sub-segments that are stacked together. This allows the total of every category value to be split into parts.
The length of every bar corresponds to a numeric value. It is difficult to compare the relative size of the sub-segments except for the first one (next to the x-axis).
Why is a stacked bar chart used?
The stacked bar chart is used for the following purposes:
- To show the larger categorical variable divided into smaller sub-segments
- To study the relative decomposition of every bar
- To compare the numeric values of the different data categories
- To show the total length of every stacked bar
What colors should be used in a stacked bar chart?
It is essential to use multiple colors to distinguish between the various sub-segments effectively. While selecting the colors, the idea is to assign one color to one sub-segment.
For every sub-segment, either diverging colors or sequential colors can be used. The diverging colors are in the form of orange, pink, blue, green, and so on. The sequential colors are in the form of very light green, light green, dark green, darkest green, and so on.
Recommended Articles
This has been a guide to the stacked bar chart in Excel. Here we learn how to Create 1) 2-D 2) 100% 2-D 3) 3-D 4) 100% 3-D stacked bar chart in Excel with examples and downloadable Excel template. You can learn more about Excel functions from the following articles –