Table Of Contents
How to Change Chart Style in Excel? (Step-by-Step)
Table of contents
- How to Change Chart Style in Excel? (Step by Step)
- Steps to Apply Different Themes or Styles to The Chart
- Style 1: Apply only Grid Lines.
- Style 2: Show Data Labels in a Vertical way
- Style 3: To Apply Shaded Column Bars
- Style 4: To Apply Increased Width of Column Bars and Shadow of Column Bars.
- Style 5: To Apply Grey Background.
- Style 6: To Apply Light Color to the Column Bars.
- Style 7: To Apply Light Gridlines.
- Style 8: To Apply rectangular Gridlines.
- Style 9: To Apply Black Background.
- Style 10: To Apply Smoky Bottom to the Column Bars.
- Style 11: Apply only borders to the Column Bars.
- Style 12: Similar to Style 1.
- Style 13: To Apply Classy Style Type 1
- Style 14: To Apply Classy Style Type 2
- Style 15: To Apply Increased bar without Gridlines
- Style 16: To Apply Intense Effect to the Column Bars
- Things to Remember
- Recommended Articles
- Steps to Apply Different Themes or Styles to The Chart
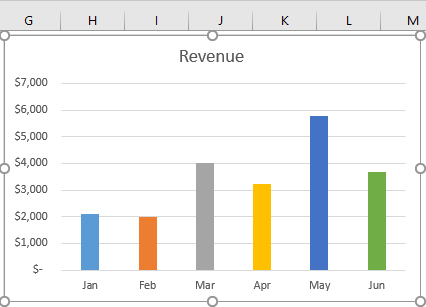
Assume you have a data set like the below one.
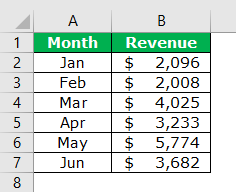
Step 1 - We must select the data and insert the COLUMN chart in Excel.
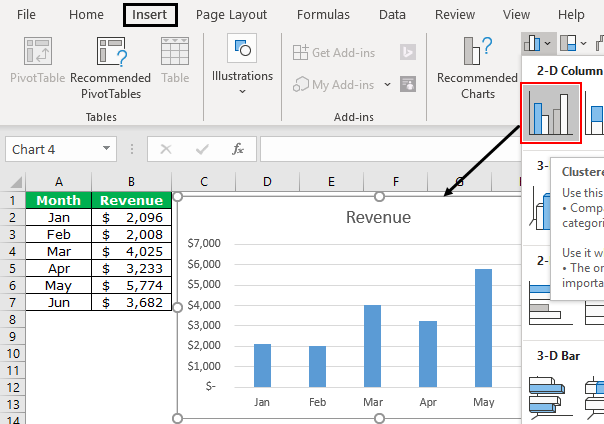
When inserting the column chart for the selected data range, we get this default chart. However, most people do not go beyond this step because they do not care about the beauty of the chart.
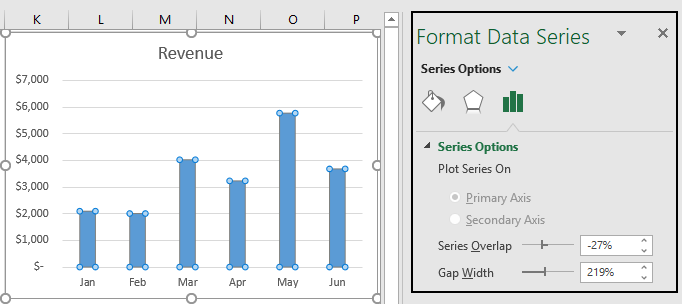
Step 2 - To open the "FORMAT DATA SERIES" option, select the bars and press "Ctrl + 1."
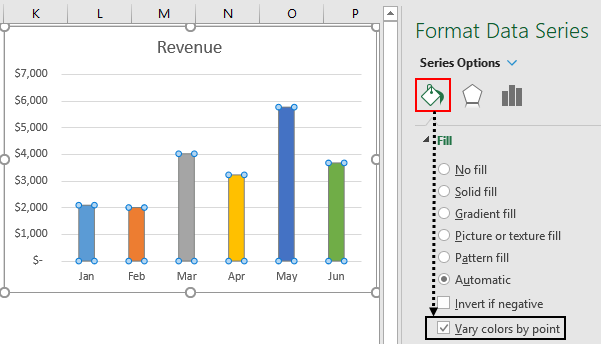
Step 3 - In the "FORMAT DATA SERIES" window, choose the "FILL" option, click on "FILL," and check the box “Vary color by point.”
Steps to Apply Different Themes or Styles to The Chart
We need to apply some themes or different styles to the chart. For this, we need to follow the below simple steps.
- Step 1: First, we must select the chart first.
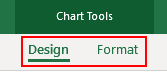
- Step 2: Two extra tabs open on the ribbon as soon as we choose the chart.
We can see the main heading as “Chart Tools,” and under this, we have two tabs, i.e., “Design” and “Format.”
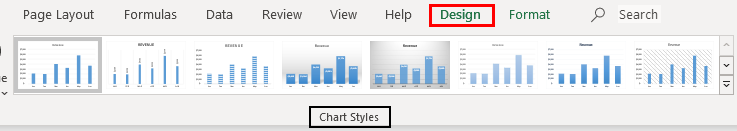
- Step 3: We must go to the "DESIGN" tab. Under this, we can see many design options. Next, go to the “Chart Style” section.
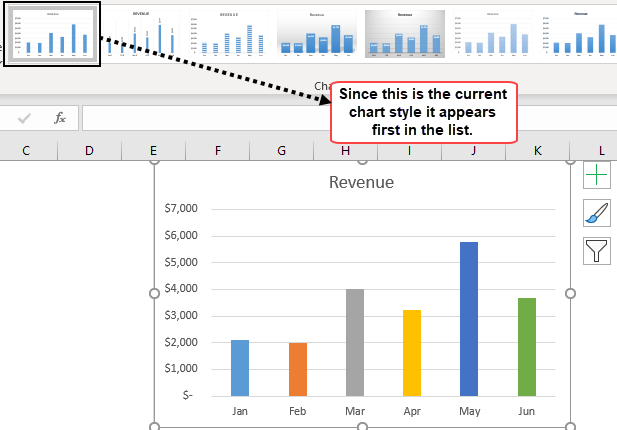
- Step 4: As we can see under "Chart Styles," we can see many designs. As per our current chart style, the first one will appear.
In Excel 2013, we have a total of 16 chart styles. So, click on the drop-down list of the chart style to see the list.
There is no specific name for each chart style. Rather, these styles are referred to as "Style 1", "Style 2", "Style 3," and so on.
We will see each style and how they look when we apply them.
Style 1: Apply only Grid Lines.
If we choose the first style, it will display only GRIDLINES in Excel to the chart. Below is a preview of the same.

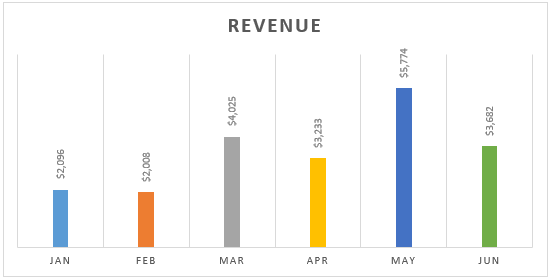
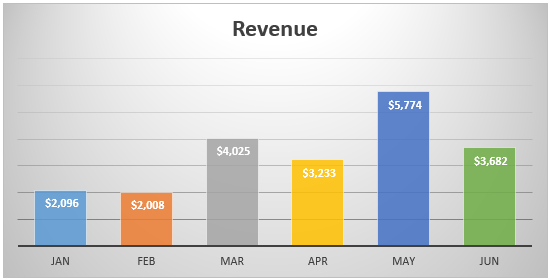
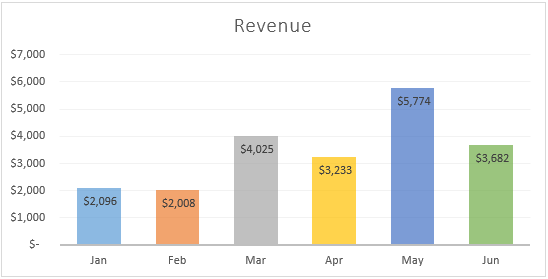
Style 2: Show Data Labels in a Vertical way
"Data Labels" are the data or numbers of each column bar. Suppose we select the "Style 2" option. We will get below the chart style.
Style 3: To Apply Shaded Column Bars
This style will modify the style of the bars from plain to shades. Below is a preview of the same.
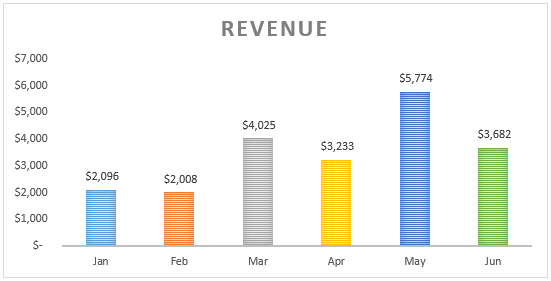
Note: "Data Labels" do not default in this style since we have selected "Style 2" in the previous step; it has come automatically.
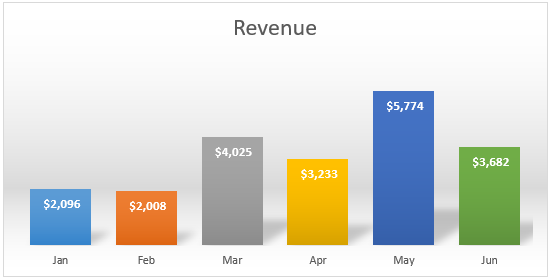
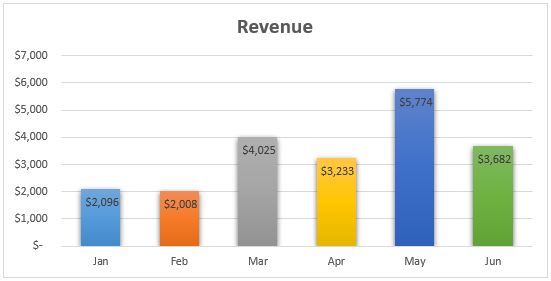
Style 4: To Apply Increased Width of Column Bars and Shadow of Column Bars.
This style will increase the width of the column bars and give each bar's shadow.
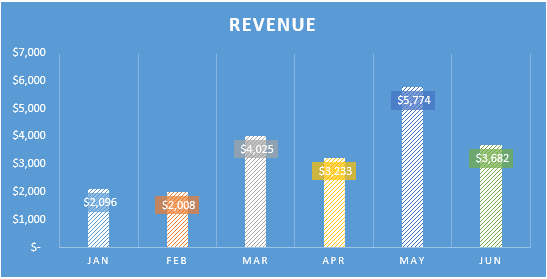
Style 5: To Apply Grey Background.
This style will apply a grey background to ”Style 4.”
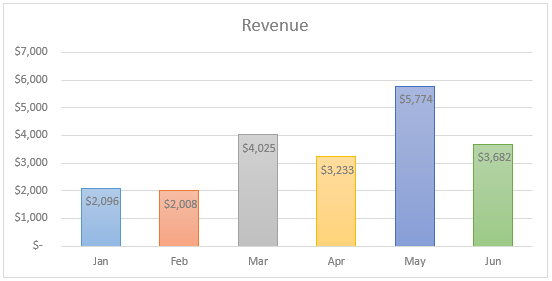
Style 6: To Apply Light Color to the Column Bars.
This style will apply light colors to the column bars.
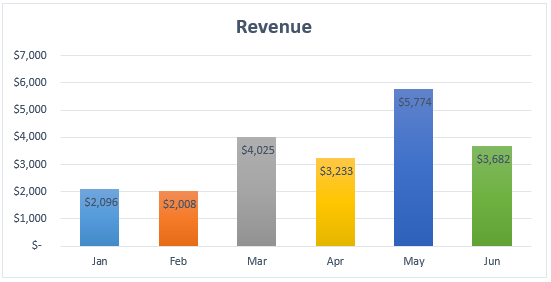
Style 7: To Apply Light Gridlines.
This style will apply light grid lines to the chart.
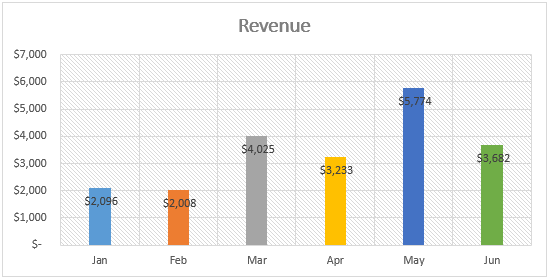
Style 8: To Apply rectangular Gridlines.
This style will apply a rectangular box type of gridline with shades.
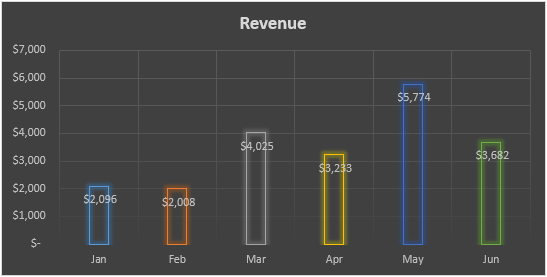
Style 9: To Apply Black Background.
This style will apply a dark black colored background.
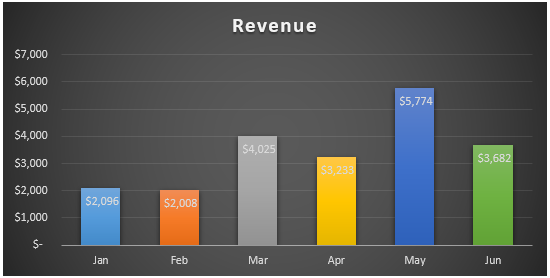
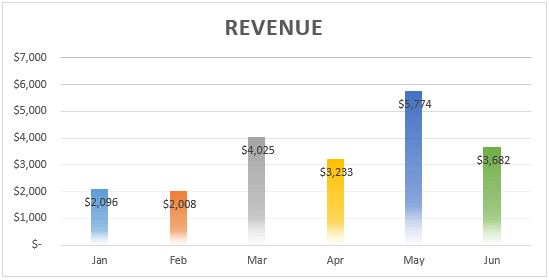
Style 10: To Apply Smoky Bottom to the Column Bars.
This style will apply the bottom of each column bar as smoky.
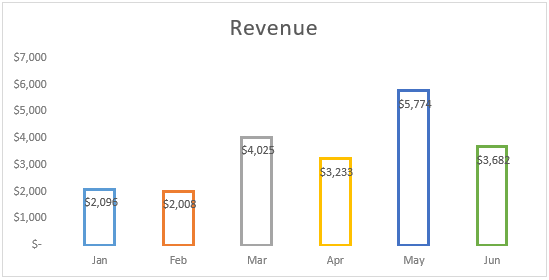
Style 11: Apply only borders to the Column Bars.
This style will apply only outside borders to the column bars.
Style 12: Similar to Style 1.
This style is similar to “Style 1.”
Style 13: To Apply Classy Style Type 1
This style will make the chart more beautiful, as shown below.
Style 14: To Apply Classy Style Type 2
This style will make the chart more beautiful, as below.
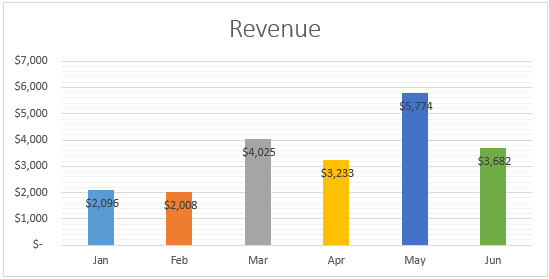
Style 15: To Apply Increased bar without Gridlines
This style will remove gridlines but increase the width of the column bars.
Style 16: To Apply Intense Effect to the Column Bars
This style will apply the "Intense Effect" to the column bars.
Things to Remember
- Each style is different from the others.
- Always choose simple styles.
- Never go beyond fancy styles, especially in business presentations.
Recommended Articles
This article is a guide to How To Change Chart Style in Excel. Here we discuss how to change chart style in Excel with examples and an Excel template. You may also look at these useful articles in Excel: -
