Sum of the Parts – SOTP Valuation

Article byDheeraj Vaidya, CFA, FRM

What is SOTP Valuation (Sum of Parts)?

Some of the parts (SOTP) is the method of valuation of the firm where each of the company’s subsidiaries or its business segment is valued separately. Then all of them are added together to arrive at the firm’s total value.

Most large companies operate in more than one business. Valuing a diversified company requires separate valuations for each business and the corporate headquarters. This method of valuing a company by parts and then adding them up is known as SOTP or its full form Sum of the Parts valuation and is commonly used in practice by stock market analysts and companies themselves. (Simple :-))

Table of contents
Sum of the Parts - SOTP Valuation

You are free to use this image o your website, templates, etc, Please provide us with an attribution linkHow to Provide Attribution?Article Link to be Hyperlinked
For eg:
Source: Sum of the Parts – SOTP Valuation (wallstreetmojo.com)

Sum of Parts Valuation (SOTP) simplified  

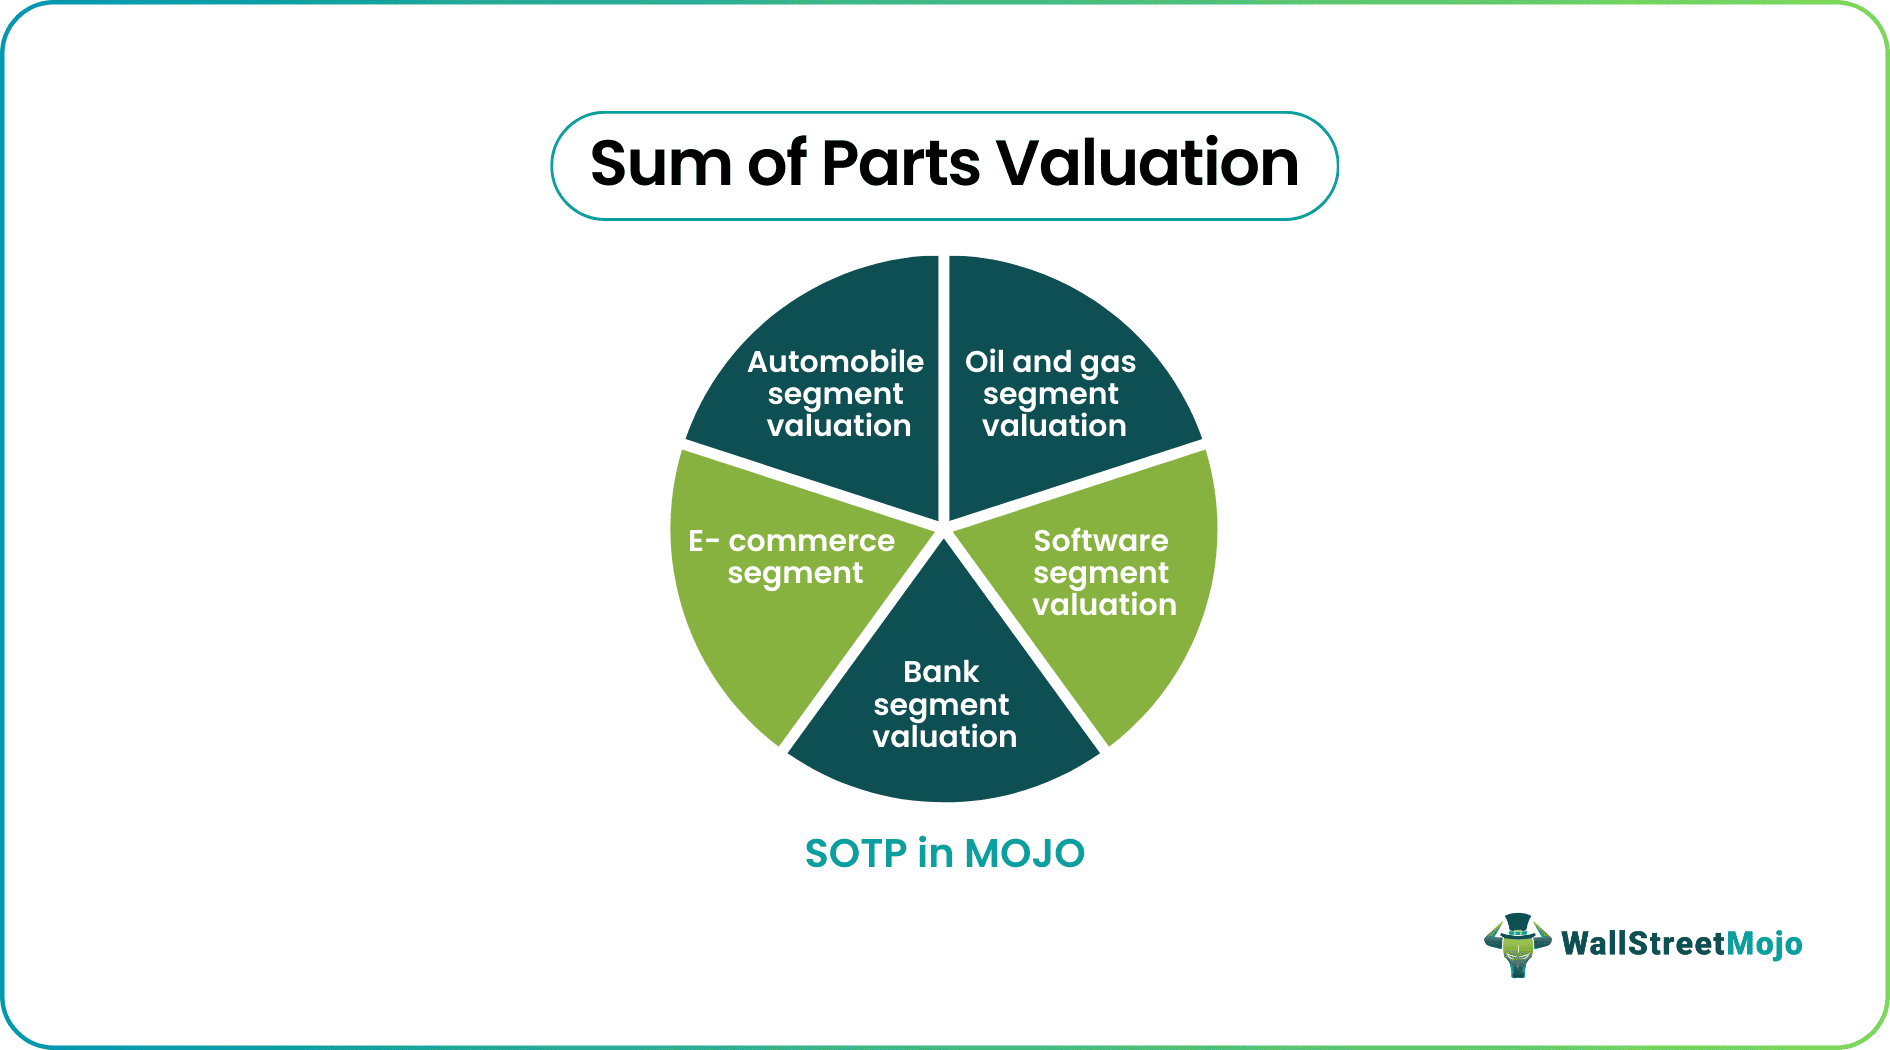
Let us understand the sum of the Parts valuation using an example of a large conglomerate company (ticker MOJO) that operates the following business segments.

Sum of Parts Valuation (SOTP) simplified 

You are free to use this image o your website, templates, etc, Please provide us with an attribution linkHow to Provide Attribution?Article Link to be Hyperlinked
For eg:
Source: Sum of the Parts – SOTP Valuation (wallstreetmojo.com)

Financial Modeling & Valuation Course (25+ Hours of Video Tutorials)

If you want to learn Financial Modeling & Valuation professionally , then do check this ​Financial Modeling & Valuation Course Bundle​ (25+ hours of video tutorials with step by step McDonald’s Financial Model). Unlock the art of financial modeling and valuation with a comprehensive course covering McDonald’s forecast methodologies, advanced valuation techniques, and financial statements.

SOTP Valuation of MOJO Corp

The common valuation techniques are Relative Valuations, Comparable Acquisition Analysis, and the DCF DCF Discounted cash flow analysis is a method of analyzing the present value of a company, investment, or cash flow by adjusting future cash flows to the time value of money. This analysis assesses the present fair value of assets, projects, or companies by taking into account many factors such as inflation, risk, and cost of capital, as well as analyzing the company's future performance.read moreAnalysis. These techniques can be applied to value MOJO Corp; however, before we do so, let us answer the questions below –

Should you apply the Discounted Cash Flow Approach to Value MOJO?

Should you apply the Relative Valuation approach to value MOJO?

What is the solution?

The solution is to value the different parts of the business separately and add the values of the different parts of the business together. This is a sum of parts or SOTP valuation.

How do we apply the Sum of Parts valuation in the case of MOJO?

To value a conglomerate like MOJO, one can use different valuation tools to value each segment.

If you are new to Relative valuation methodologies, you can read the following articles to enhance your learning of valuations –

Sum of Parts Valuation (SOTP) Example – ITC

Let us apply SOTP on ITC Ltd, a large conglomerate based in India. ITC has a diversified presence in Cigarettes, Hotels, Paperboards & Specialty Papers, Packaging, Agri-Business, Packaged Foods & Confectionery, Information Technology, Branded Apparel, Personal Care, Stationery, Safety Matches, and other FMCGFMCGFast-moving consumer goods (FMCG) are non-durable consumer goods that sell like hotcakes as they usually come with a low price and high usability. Their examples include toothpaste, ready-to-make food, soap, cookie, notebook, chocolate, etc.read more products.

While ITC is an outstanding market leader in its traditional businesses of Cigarettes, Hotels, Paperboards, Packaging, and Agri-Exports, it is rapidly gaining market share even in its nascent Packaged Foods & Confectionery, Branded Apparel, Personal Care, and Stationery.

As each of ITC’s businesses is vastly different from the others in its type, the state of its evolution, and the basic nature of its activity, the challenge for analysts, therefore, lies in fashioning a model that addresses the value for each of its unique businesses and then arrives at a value for the company as a whole.

Below are the segment details of ITC
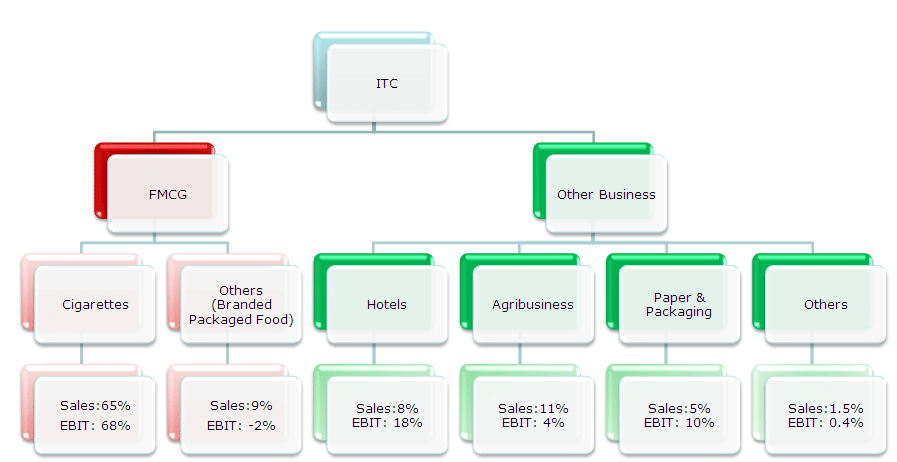
Sum of Parts Valuation Case Study

(p.s. The data taken is from 2008-09 annual reportsAnnual ReportsAn annual report is a document that a corporation publishes for its internal and external stakeholders to describe the company's performance, financial information, and disclosures related to its operations. Over time, these reports have become legal and regulatory requirements.read more  and does not reflect the current performance of the breakup of ITC Ltd Segments. This case study of ITC valuation should only be used for educational purposes and does not be construe any investment advice)

Let us apply the Sum of Parts – SOTP Valuation approach here

Segment 1 – Cigarette Segment Valuation

A cigarette is the core business of ITC and the major revenue contributor. It contributes more than 65% to the total revenues generated, and 68% of profits are generated by this segment only.
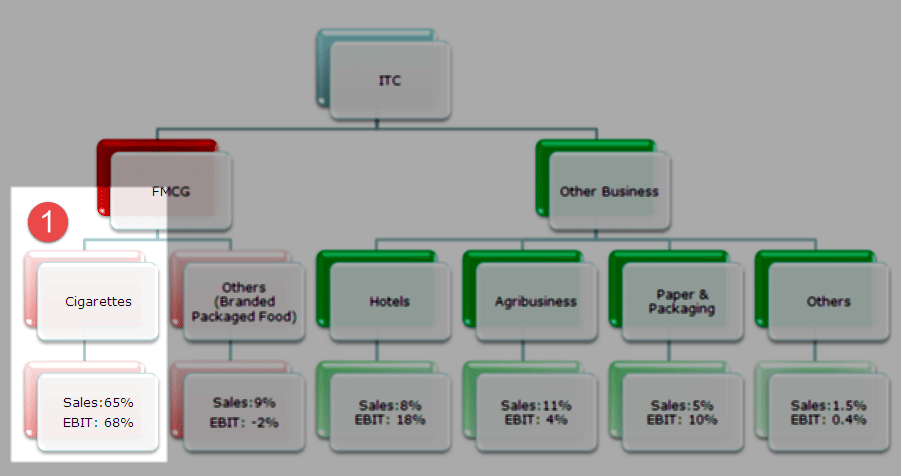
ITC Sum of Parts Valuation Case Study - Cigarette Segment

Step 1 – Understand the Key Characteristics of Cigarette Segment

  • ITC’s monopoly status within the cigarette industry
  • ITC’s volume growth of 3.7% has been twice that of the industry in the past 15%
  • Faster growth considering low cigarette penetration.

Step 2 – Choosing an appropriate Peer Group – Indian Peers

  • Godfrey Philips: Strong player in the middle price segments
  • VST Industries: Lower end in the market
  • GTC Industries: Lower end in the market

The data below reflects the market share and value share of this segment.
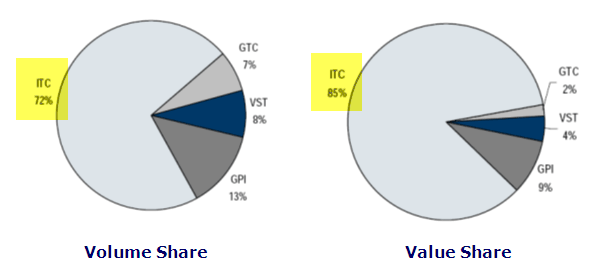
ITC Cigarette Segment - Volume Share and Value Share.

Step 3 – Comparable Company Valuation Analysis for these Indian peers.
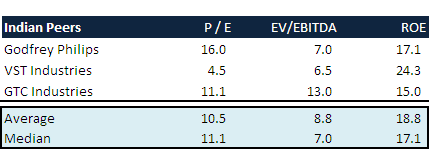
ITC - Cigarette Segment - Indian Peers

Practical Problem in identifying peers As you can see from the above charts, ITC has a clear monopoly in the Cigarette segment (both volume and value share). So how can we compare the valuation of the ITC segment with the valuation of much smaller peers? With this, we should look for global peers who may be of similar size.

Step 4 – Choosing an appropriate Peer Group – Global Peers

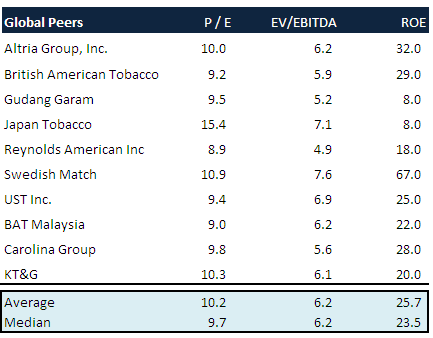
Below is the list of Cigarette Segment global peers and their valuation multiples –

ITC - Cigarette Segment - Global Peers

Step 5 – Identifying the Most suitable valuation methodology

The most appropriate valuation multiple for valuing ITC Cigarette Segment is P/E or EV/EBITDA Multiple

Segment 2 – ITC Hotel Segment Valuation

Contributes only 8% to sales but approximately an 18% contribution to EBIT.
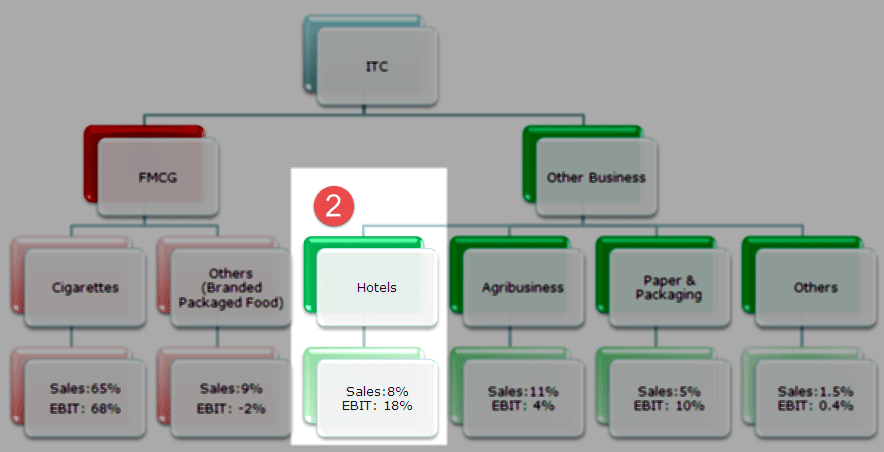
ITC - Hotel Segment

Step 1 – Key Characteristics of Hotel Segment

  • Asset intensive and has a long gestation period business.
  • High Margins

Step 2 – Identify Listed Peers in Hotel Segment

ITC - Hotel Segment Peers and Valuation

Step 3 – Choose an appropriate valuation multiple  

For valuing the hotel segment, the valuation of multiple approaches like Enterprise value/room or PE or EV/EBITDA can be used.

Segment 3 – Paper Segment Valuations

The paper and packaging segment contributes 5% of Sales and 10% to ITC’s EBIT.

ITC - Paper and Packaging Segment

Step 1 –  Note the Key Characteristics

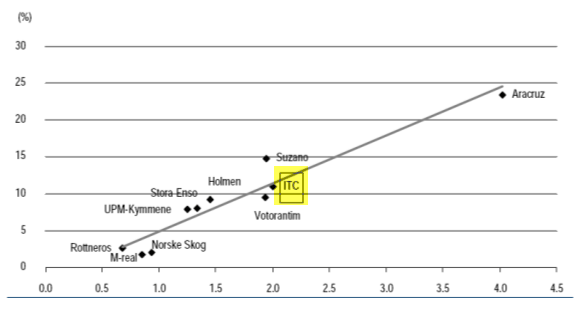
ITC - Paper Segment - PBV to ROE graph

Step 2 – Identify the Key Comparables

No visible listed Indian Peer

Step 3 – Choose the appropriate Valuation Multiple

  • Prefer P/BV as this segment is an asset-intensive segment and no visible listed Indian Peer
  • Benchmarking P/BV multiple to the average of the Global Peers may be the correct approach

Segment 4 – FMCG (Non-Cigarettes) Segment

FMCG (non-cigarettes) segment contributes 9% of Sales; however, this segment is unprofitable and results in an EBIT margin of -2%.
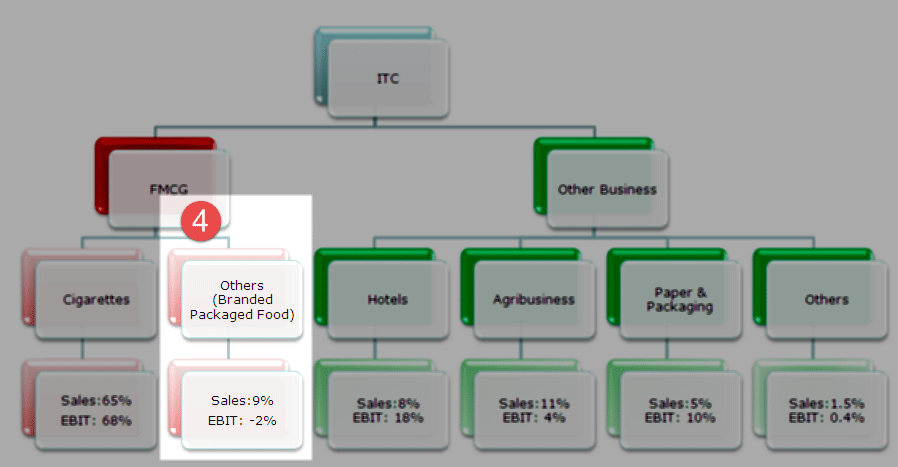
ITC Non FMCG Segment

Step 1 – Identify the Key Characteristics 

  • Non-profitable, negative earnings

Step 2 – Listed Comparables Operating in the same segment
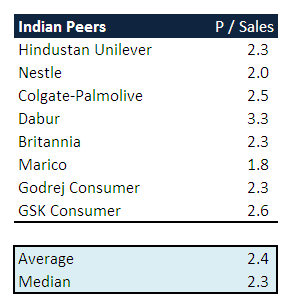
ITC - Non FMCG Segment Peer

Step 3 – Choosing the Right Valuation Multiple –

  • EV/Sales or P/Sales could be used to value the company

Segment 5 – Agriculture Segment Valuation

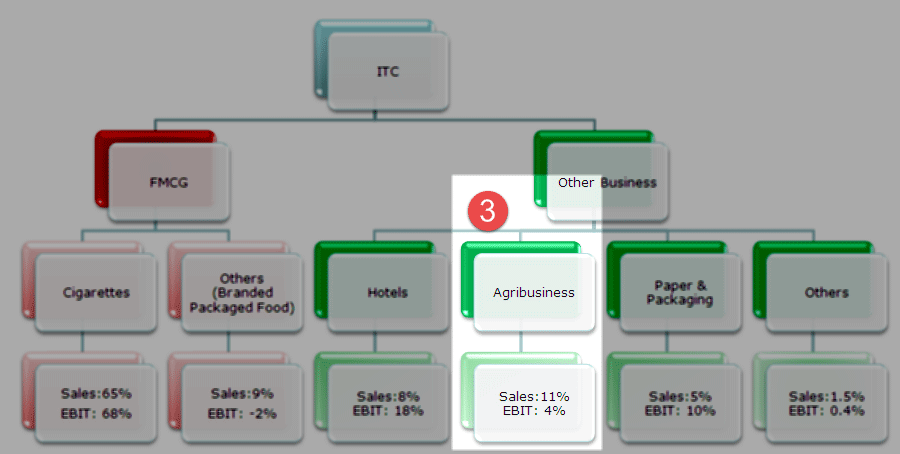
The agriculture segment contributes 11% of Sales for ITC and 4% of EBIT.
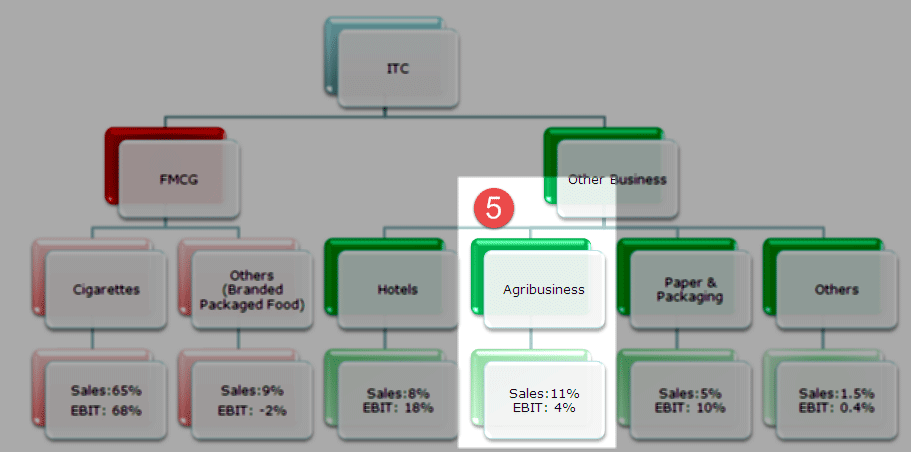
ITC - Agriculture Segment

Step 1 – Identify the Key Characteristics

  • The earnings contribution of this business is very small (EBIT contribution is less than 4%)

Step 2 – Choose an appropriate Peer

  • No publicly listed peer group available

Step 3 – Choose an appropriate Valuation Multiple

  • Agriculture multiple should be based on the fact that it is a trading business
  • We may use a PE multiple of 10x for valuing this agriculture commodity business.

Summing it all together – Sum of Parts – SOTP Valuation of ITC

Below is the table that consolidates the valuation of all five segments. Please note that the various scenarios are used to evaluate the fundamental value of ITC. E.g., If Global Peers (PE) is used for valuing the FMCG segment, then the contribution to the share price is Rs110/share. However, if you used Global Peers (EV/EBITDA), the contribution would have been Rs105/share.

The final Sum of Parts valuation is =

Rs110 (FMCG-Cigarettes) + Rs21 (Hotel Segment) + Rs25 (FMCG – non cigarettes) + Rs15 (Paper and Packaging) + Rs3 (Agriculture Business) + Rs13 (Cash per share) = Rs187/share.
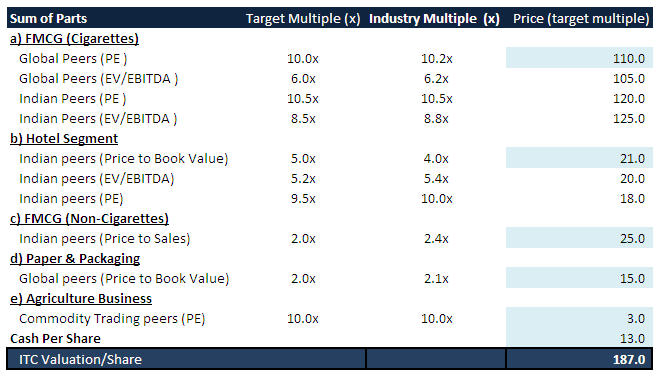
ITC Sum of Parts Valuation

Sum of the Parts Valuation – SOTP  – Waterfall Charts

The analysis done using the Sum of Parts looks stunning once you use the Waterfall ChartsWaterfall ChartsA waterfall chart, also known as a bridge chart in Excel, is a form of column chart that shows how the starting position of a series of data changes over time, whether it is increasing or decreasing.read more to communicate the analysis to the clients. Below is the waterfall chart of ITC Ltd Sum of Parts Valuation.The analysis done using the Sum of Parts looks stunning once you use theThe analysis done using the Sum of Parts looks stunning once you use the Waterfall ChartsWaterfall ChartsA waterfall chart, also known as a bridge chart in Excel, is a form of column chart that shows how the starting position of a series of data changes over time, whether it is increasing or decreasing.read more to communicate the analysis to the clients. Below is the waterfall chart of ITC Ltd Sum of Parts Valuation.

Download – ITC Waterfall chart 

ITC-Share-Price-Sum-of-Parts

SOTP and Diversification Discount

Diversification discount also known as a conglomerate discountConglomerate DiscountA conglomerate in business terminology is a company that owns a group of subsidiaries conducting business separately, often in distinct industries. It reflects diversification of operations, product line and market to allow business expansion.read more, typically arises when you value a company using the Sum of the Parts or SOTP. This happens because multiple business segments are valued where there is no adequate information on business metrics and a lack of management focus.

Diversification discounts range from 10% to 30% generally. However, it may change significantly for specific countries. For example, in India, the Diversification discount used for SOTP could be as high as 50%.

Limitations of Sum of the Parts Valuation

  • The sum of parts or SOTP relies on adequate information provided for each segment. However, in most conglomerates, sufficient information is not available to value each business segment.
  • Segment valuation under SOTP depends on the stage of its business cycleBusiness CycleThe business cycle refers to the alternating phases of economic growth and decline.read more. This information is sometimes very difficult to find out due to limited information availability.
  • Another problem with the sum of parts is that there are various synergies and cost savings associated with the functioning of each segment when they operate as a part of a conglomerate. While evaluating the segment separately, the synergies and costs are not available.
  • SOTP valuation can only be fully realized if the management decides to break up the segments and run them as a separate company/unit. However, this becomes impossible as “company size” and management remuneration are generally closely linked, and the spin-off may not be in their interests.

What’s Next?

If you learned something new or enjoyed the post on SOTP Valuation, please leave a comment below. Let me know what you think. Thanks and take care.

Sum of the Parts Valuation Video


Reader Interactions

Comments

  1. Ernesto Gallo says

    Thank you for your publication. In our countries, with efficient capital markets, DCF of business units and sum of parts would be useful.

  2. Sohel Sarwar Jahan says

    In manufacturing company which valuation method is better?

    • Dheeraj Vaidya says

      Hi Sohel, For a manufacturing company you can use relative valuation tools like PE and EV to EBITDA. Also, you can apply DCF method for valuations.

  3. Imran says

    Hi sir can you please explain how you arrived at the target price of each segment. This question is already being raised by one of the viewer

    • Dheeraj Vaidya says

      Hi Imran,

      Sorry for not making this clear in the post. As an example, if you look at Step 4, the average PE for Global Peers comes out to be 10.2x. Also, please note that to apply sum of parts, we also require EPS of each segment. With the EPS information of the segment, we can multiple this by 10.2 to find the fair price of that segment.

      Hope it is clear nnow.

      Thanks,
      Dheeraj

  4. Akula says

    Hi, Dheeraj, thanks very much for your sharing and it’s very good to learn from your website with step by step approach, pls advise what types of valuation multiples to use in comparing different industries / businesses ? Any guidelines on this as there are so many categories of industries / businesses, thanks a lot !

    • Dheeraj says

      Hi Akula,

      For each category you need to value using different industry based valuation multiple. You can learn more about relative valuations from Enterprise value vs Equity Value

      Thanks,
      Dheeraj

  5. Gaurav Gandhi says

    Thank you for sharing the insights into valuations…I too have used EV/Sales, EV/EBITDA & P/E (with x-times bands) valuations.

    However, i would like to know, beside Valuations, in Equity-research analysis (also for Project-finance/Debt-syndication), “Financial-projections/estimates” for future years are carried out. My lord, my question is “HOW WILL WE DERIVE THE GROWTH RATE?” I have observed that much of our final-opinion on stock/future-prospects is dependent on this GROWTH-RATE…I used to generally think Growth-rate is taken as lesser of these (conservative approach) :-
    1. Industrial-growth rate OR
    2. Using SUSTAINABLE GROWTH RATE (ROE*RETENTION RATIO) ie; Revenues will be increase for future years @ SUSTAINABLE GROWTH rate, Variable cost will vary according to sales, FC as it is, Working-cap will vary @ % of change in sales/Purchase, Cash-flows also to be worked out & put in prospective-B/s,…
    I RATHER FOUND THESE THE MOST DIFFICULT EXERCISE, unless there is a DISCUSSION WITH THE MANAGEMENT about their future-expansion plans/Capacity-levels/Budgeted-sales & other figures available…Also, it becomes quite difficult when we work on Excel (without use of some Research-based software)

    I, was however, rebutted when I gave an interview at CRISIL, they asked me certain thought-provoking questions : Won’t u adjust varying INFLATION RATES in ur cost for future? What about Foreign-exchange fluuctuations in future? I realized that ascertaining GROWTH RATE FOR FINANCIAL-PROJECTION cannot be given a straight-jacket formula or taking blindly industrial growth rate, but have to account various factors like Economic/Forex /Budgeted-levels from management/Future-expansion or ongoing acquisition…all these factors can widely change the GROWTH RATE & consequently, the whole analysis & outlook for the company.

    I just want a guidance on how Large global-research/IB houses, project financials (including P&l,B/s,CFS) esp; w.r.t GROWTH RATE…Do they consider all such factors impacting growth (else, any wrong estimation will make the whole analysis worthless)

    Please throw light on this as I have never gotten opportunity to work in big-houses.
    – CA

    • Dheeraj says

      Hi Gaurav,

      Thanks for your note. You actually pointed out a very interesting debate on what growth rates to be taken. I have seen that each analyst in Investment Bank have their own understanding of growth rates and their own justification of taking such approach. My rule of thumb for growth rate is to take it as less than the GDP Growth rate of the company. If you take it higher than the GDP growth rate, then it is very easy to prove that the concerned company will outgrow the country in future.

      You are right in pointing out that growth rates have significant effect on projections and valuations. It is therefore important to present the client with the sensitivity analysis of how your valuation changes with different growth rates. (obviously your assumption may not echo your client’s assumption and they may want to evaluate other scenarios).

      Thanks,
      Dheeraj

      • Gaurav Gandhi says

        Thank you, Mr. Dheeraj, for your reply.
        I would regularly follow your blog, now on.

        Thanks,
        Gaurav Gandhi, CA

  6. Henry Ababio says

    Great and evasive stuff explained and illustrated in very simple terms, Great effort!, thanks.

    • Dheeraj says

      thanks Henry!

  7. Sudipta Saha says

    The article is really insightful. I have a doubt- If I wanna do valuation of Titan do I need to apply SOTP? considering 80% of its business comes from jewelry, 15% from watch and rest from other segment. And both watch and jewelry are similar kind of businesses..consumer oriented discretionary spending

  8. Mayank says

    Helpful article.

    Can you please also elaborate how to value a specific part of a business. For example, if a pharma company has generic and specialty products and within the specialty products, orthopedics is a sub-segment. Then how to value the orthopedic sub-segment.

  9. Marius says

    Why did u use EV/EBIT on the software segment?

  10. Arinjay says

    superb blog

  11. Rahul says

    Can u please elaborate on why you have taken target multiple as 10x while the peers average is 10.2x? I understand its a small difference but why is it some rule? or u just wanted to be conservative?
    Basically what is the difference between target multiple and industry multiple?

    Lots of regards for such a nice explanation.

    • Wall Street Mojo says

      Hi Rahul,

      Thanks for your question. There is no specific reason for me to take 10x instead of 10.2x. You may take 10.2x to be precise.

      Regards,
      Dheeraj

  12. Ritesh says

    Hi,

    I would like to know how did you come up with the price of each segment and eventually add that up to get the price of the stock? I just couldn’t understand how cigarette’s business is priced at 110 and so on. Can you please explain it to me here or email me on [email protected] I am in dire need to know this.

  13. Rahul Alok says

    Hi sir

    Your blog is superb for the beginners, easy to understand and simple way used.

    However in each valuation you have told the method to be used. I am stuck here with a question that why this type of valuation is used ( in each business segment in ITC ) ??

    Regards

  14. sonal says

    thank you sir… It is a very interesting posts & helpful to understand valuations. above valuations technique can be used on L&T like big entities for further understanding.

    For what type decisions can the above charts & nos. be used from company & investor view point ???

  15. NILESH JAIN says

    HELLO DHEERAJ SIR
    FIRST OF ALL THANKS TO YOU
    YOUR WAY OF PRESENTABILITY IS VERY CLEAR.
    YOU ARE SHARING VERY KNOWLEDGEABLE INFORMATION ON SOTP.
    I’M STARTING OUR CAREER IN EQUITY RESEARCH. THIS IS VERY HELPFULL FOR ME.
    THANKS
    NILESH JAIN

  16. Rakhi says

    Dear Sir
    Thanks for sharing this information with me.
    This information surely helps me in my future.

  17. NASIR RAZA says

    IT IS REALLY INFORMATIVE AND TECHNICAL EXPLANATION PRECISELY DEFINED WITH ILLUSTRATIONS
    FOR THE CONVENTIONAL BANKERS AND VALUERS WHO ARE BIG HURDLE IN BUSINESS VALUATION.
    MULTI SEGMENT BUSINESSES MOST OF THE TIME FACE WORKING CAPITAL REQUIREMENTS AND OUR CREDIT RISK MANAGERS USE THEIR THEORIES RATHER ANALYZING THE TOTAL BUSINESS STRENGTH OF A DIVERSIFIED NATURE OF BUSINESS.MOST OF THE BUSINESSES CLOSE DOWN THEIR LOW YIELD OR LOSS BUSINESS SEGMENT RATHER TO SUPPORT AND MAKE IT A PROFITABLE VENTURE.

  18. M.Ramanarayanan says

    Dear sir
    I am very happy to see your mail with illustrations.I am willing more learn and practice in the finance terminology.please reply.
    Regards
    M.Rama

  19. Sachin says

    Really thankfull……….Please share some basics about M & A if possible.

  20. UTKARSH NAIK says

    Thank you so much for such a good explanation.

  21. Suman says

    Dear Dheeraj,

    You article is very worth reading. But I have some confusion on selecting the right valuation multiples. Please provide me some more insights for selecting right valuation multiples.

    Thanks
    Suman

  22. Navaneetha says

    Wonderful illustration. Thank you!

  23. Nalini says

    Hey Dheeraj,

    Your explanation was extremely useful, elaborate and easy to understand.

  24. rashmi says

    Enjoyed reading… Thank you and please explain some more techniques of valuation.

  25. Pravin says

    Really helpful

Leave a Reply

Your email address will not be published. Required fields are marked *