What Is Comparable Company Analysis?
Comparable comps are nothing but identifying doing relative valuations like an expert to find the firm’s fair value. The comparable comp process starts with identifying the comparable companies, then selecting the right valuation tools, and finally preparing a table that can provide easy inferences about the fair valuation of the industry and the company. It is Part 2 of the equity valuation series articles.
Comparable Company Template www.wallstreetmojo.com
Download Excel Template
To fully understand these concepts, one should know about Relative Valuation Multiples like EV/EBITDA, PE Ratio, Price to Book value, PEG Ratio, etc. However, If someone wants a quick refresher, they may refer to Part 1 of this equity valuation series that covered the topic of Relative Valuation multiples.
Key Takeaways
- Comparable company analysis is valuable for determining a company’s fair value. It involves identifying similar companies, selecting appropriate valuation methods, and creating a table to conclude the industry and the specific company being evaluated.
- Knowledge of Relative Valuation Multiples such as EV/EBITDA, PE Ratio, Price to Book value, PEG Ratio, etc., is essential to understand these concepts.
- The peer group analysis, or the comparable company analysis model, assists investors and financial advisors in making informed decisions using financial metrics and multiples
Comparable Company Analysis Explained
The process of comparable company analysis model is also referred to as peer group analysis. It is very widely used in the in the field of investment analysis and corporate finance. In this process two or more companies with similar nature in the form of industry or type of sector, production, size, financial strength, market capitalization, etc are compared to make investment decisions.
In other words, various valuation multiples and financial metrics are used to make the comparison. Such data is useful for investors and financial advisors.
Let us now try and understand what a comparable “Company” analysis is? Or Comparable comps. Below is the definition sourced from Investopedia.
From the above apartment related discussion and Investopedia definition, we can draw the following inferences regarding comparable analysis –
- Like comparing the apartments, comparable company analysis helps compare different companies with similar sizes and industries and derive a fair value for them.
- Instead of looking at the number of beds, location, bathrooms, etc. look at relative valuation multiples (EV/EBITDA, PE, P/BV, etc.).
- We infer from a comparison that a company’s price is overvalued or undervalued.
With this basic analogy, we should be able to proceed and move forward to reading the comparable company analysis.
Video Explanation of Comparable Company Analysis

Examples
(also called as “Trading Comps”, “Comparable Comps”)
Comparable analysis or Trading comps can be best explained with the help of an example and and comparable company analysis template.
Example #1
Let’s assume that someone is planning to buy a house in New York (why not?). They may search on the many real estate brokerage websites and would also draw a comparative study on the same. They would compare one apartment with another and try to get a sense of what they are worth compared to each other.
https://www.trulia.com/NY/New_York/
When comparing apartments, one would consider different attributes such as the number of rooms, size of bedrooms, number of bathrooms, layout, etc. In doing so, they would notice that apartments with similar kinds of attributes may cost similarly!
Example #2
For learning to read a and comparable company analysis template or Comparable Comps, I will take a real-life example, Box Inc, which had earlier announced its IPO. We want to understand at what valuation price point we should invest in Box Inc IPO shares.
Below is the comparable company analysis table for Box IPO. There are broadly 5 parts to the trading comps table –
- Company Information –
- This includes Company Name, Ticker, and Price. The ticker is a unique symbol given to the company to identify publicly listed companies.
- We may take Bloomberg, Reuter’s tickers as well. Also, note that the prices that we take here are the most recent prices.
- We make the table so that these prices are linked to the database, where they would get updated automatically.
- Size of the company –
- This includes Market Capitalization and Enterprise Value.
- We normally sort the table based on Market Capitalization. Market Capitalization also provides us pseudo for the size of the company.
- Enterprise Value is the current Market-based valuation of the firm.
- We may not want to compare a small market capitalization company with a large one.
- Valuation Multiples –
- The comparable company analysis model should include 2 to 3 appropriate valuation tools for comparison
- We should ideally show one year of historical multiple and two years of forwarding multiples (estimated)
- Choosing an appropriate valuation tool is the key to successfully valuing the company.
- Operating Metrics –
- It may include fundamental ratios like Revenue, growth, ROE, etc
- It is important to understand the fundamentals of the company at once.
- To make this comp more meaningful, one may include Profit Margins, ROE, Net Margin, Leverage, etc.
- Summary –
- It is a simple mean, median, low, and high of the above metrics
- Mean, and Median provides core insights to the fair valuation
- If a company’s multiple is above the mean/median, we tend to infer that the company may be overvalued
- Likewise, if the multiple is below the mean/median, we may infer that it is undervalued.
- High and Low also help us understand the outliers and a case to remove those if they are too far away from the Mean/Median.
Analysis Summary
Let us now look at the summary of the Comparable Company analysis of Box IPO.
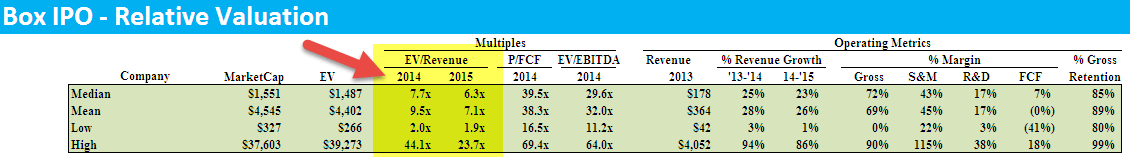
We can infer the following from the above table –
- Cloud companies are trading at an average of 9.5x EV/Sales Multiple.
- We note companies like Xero are an outlier that trades at 44x EV/Sales multiple (expected 2014 growth rate of 94%).
- THE lowest EV/Sales multiple is 2.0x
- Cloud companies trade at EV/EBITDA multiple of 32x.
- From the financial model of Box, we note that Box is EBITDA Negative, so we can’t proceed with EV/EBITDA as a valuation tool. The only multiple that is suitable for valuation is EV/Sales.
- Since the median EV/Sales is around 7.7x, and the mean is around 9.5x, we may consider making three scenarios for valuations.
- Optimistic case of 10.0x EV/Sales, Base Case of 7.1x EV/Sales, and Pessimistic Case of 5.0x EV/Sales.
The below table shows the per-share price using the three scenarios.
- Box Inc valuation range from $15.65 (pessimistic case) to $29.38 (optimistic case)
- The most expected valuation for Box Inc using Relative Valuation is $21.40 (expected)
How To Do?
Comparable analysis’s most important element is identifying the right set of comparables. Comparing the value of apples to oranges does not make any sense here. It is important to conduct a preliminary study on comparable company analysis for private companies and public companies, and it generally involves these three steps –
a) Identifying the industry
- Try to zero down the industries in which the companies are classified.
- It can be tedious as different sources would give different industries for the same company, and also, the industry names would be different in various sources.
- Generally, the classifications available are very broad and cannot be relied on completely.
- If there is no surety about the industry classification (which is the case most of the time), try to identify some keywords relevant to the business descriptions of the companies. E.g., For a Building materials company, the relevant keywords can be – roofing, plumbing, framing, insulation, tiling, construction service, etc.
- Though this example is simple, for applying the same in real-life scenarios, one needs to establish the value and the value driver and make several adjustments.
b) Understand the Company description
- It is important to understand the business to select comparable companies.
- Try to find out the detailed business description of the company.
- Possible sources for this in the order of preference would be:
- Company Website
- Research reports
- Company Filings (Latest 10K, Annual Report, etc.)
- Yahoo Finance
- Note: Company websites are very useful in helping to visualize all the products and services, but research reports and company filings provide actual segment data to give a true business mix of the company. Additionally, professionals often rely on comprehensive platforms such as the Tofler – company 360 report to access detailed company insights, financials, and ownership data when conducting thorough comparable company research.
c) Identify key competitors
- Comparable company analysis for private companies and public companies can be identified from the following sources in the order of preference:
- Research Reports
- Company Filings – Competition Section
- Yahoo Finance – Competitors and Industry sections
- Hoovers – Competitors and Industry sections
Excel Template
The key to preparing the comparable company analysis or Trading comp is to arrive at the right multiple (EV/Sales, P/E, etc.). Below is a sample summary Comparable comp analysis excel sheet –
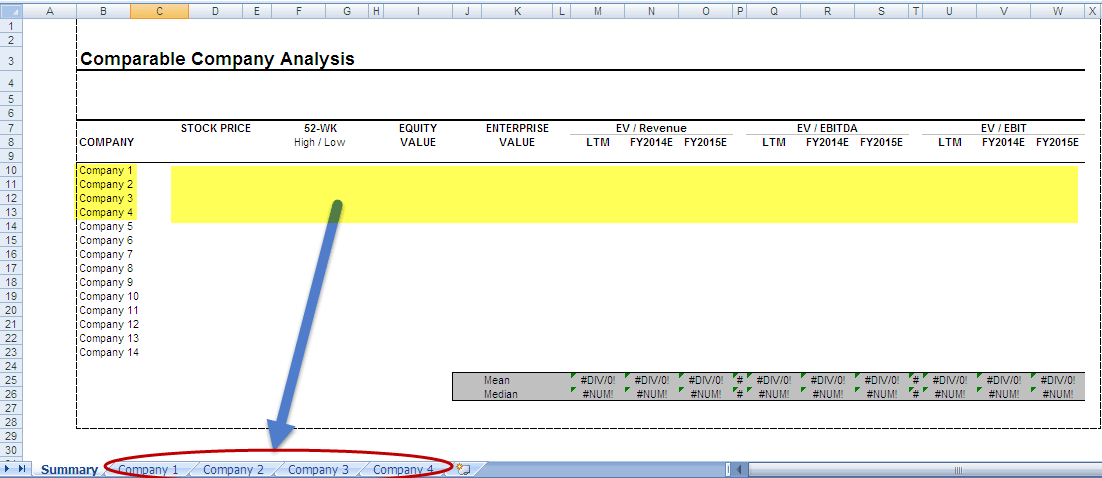
Preparing the comparable comp table is not difficult; however, correctly calculating the requisite valuation multiple. The requisite output of Company 1, Company 2, and Company 3 is linked from the input tabs “company 1”, “company 2”, and “company 3,” respectively. Hence, we will focus on correctly calculating these multiples with an in-depth example.
You can download the comparable comp excel template from here – Comparable Company Template.
Key Formulas used:
- Basic Equity Value = Common Shares Outstanding * Share Price.
- Diluted Equity Value = Diluted Shares Outstanding * Share Price
- Dilution from Options = Options – ( Options * Exercise Price) / Share Price
- Dilution from Convertibles = Convertible Bonds * Conversion Ratio
- Enterprise Value = Equity Value – Cash + Debt + Minority Interest + Preferred Stock
- The exercise price or conversion price needs to be below the share price for the dilution calculations above.
If the conversion price or the exercise price is above the Share Price, there will be no dilution, options will not get exercised, and the conversion of bonds will not occur.
Steps
Here, let us consider the steps to make the calculation and comparable company analysis valuation.
- Input basic information
- Input Balance Sheet information
- Calculate “in the money” stock options
- Calculate “in the money” convertible securities and find the diluted EPS
- Calculate the LTM numbers (ex non-recurring items)
- Calculate the Equity Value and Enterprise Value
- Calculate the respective multiples
Let us now proceed step-by-step to understand this fully. I have taken an example of Robert Half International (Ticker – RHI), and even though the data used here is pretty old (2006 10K and 10Q), I am sure it will still prove to be useful for understanding the general methodology.
Step 1: Input the basic information for a comparable company
Step 2: Input the latest available Balance Sheet information
Step 3: Calculate all the “in the money” stock options
Also, look at the Treasury Stock Method and Restricted Stock Units.
Step 4: Calculate all the “in the money” convertible securities
As with options,we only get dilution from convertible bonds if the company’s current share price exceeds the bonds’ conversion price.
How we Factor Convertible Bonds Into Enterprise Value: If the convertible bonds are in the money (they can convert to shares), we calculate the dilution and add them to the shares outstanding. If they’re out‐of-the‐money (they cannot convert into shares), we count the bonds as debt instead.
- Dilution from Convertibles = Convertible Bonds * Conversion Ratio
- Convertible Bonds = Convertible Dollar Amount / Par Value
- Conversion Ratio = Par Value / Conversion Price
- Conversion Price = Par Value / Conversion Ratio
Step 5: Calculate the LTM numbers (ex non-recurring items)
(If you are wondering what are non-recurring items, then do have a look at the detailed post on non-recurring items)
Step 6: Calculate the Equity Value and Enterprise Value
Step 7: Calculate the respective multiples
Step 8: Important adjustments
| Items | Things to Note | Add / Subtract | Additional Info |
| Cash | Think of Cash as a “free gift” when you buy a company – it reduces your effective price because you get the target’s entire Balance Sheet as part of the acquisition. | Subtract | You almost always include Short‐Term Investments as part of the Cash number, but Long‐Term Investments depend on the liquidity and what your bank usually does. |
| Debt | Debt refers to loans that a company has taken out. Normally when you buy a company, you’re required to refinance its debt, so it’s counted as one of those “hidden costs” to make an acquisition. | Add | All debt‐related items should be counted in this number – short‐term debt, long‐term debt, revolvers, mezzanine, and so on. The only exception: convertible bonds, which may or may not be counted. It’s better to use market values for debt, but if you don’t have them, you can just use what’s listed on the Balance Sheet (book values). |
| Preferred Stock | Preferred Stock is very similar to Debt – investors receive a guaranteed dividend, usually in the form of an interest rate on the Preferred Stock balance. | Add | Preferred Shares are listed on the Liabilities & Shareholders’ Equity side of the Balance Sheet. |
| Minority Interest | When you own more than 50% of another company, Minority Interest refers to the percent that you DON’T own. You need to add it back to Enterprise Value because the other company’s revenue and profit are included in your own financial statements, so you need to make sure its value is reflected in EV. | Add | Minority Interest is listed on the Balance Sheet, under Liabilities or Shareholders’ Equity – in most cases, you’re fine listing what’s in the filing, but if you have market numbers, you can use them. |
You can also look at SOTP Valuation and DCF or Discounted Cash Flow approach to enhance your knowledge in valuations.
Pros And Cons
The comparable company analysis valuation has many pros and cons. Let us try to identify the pros of the concept first.
Pros
- Market based – The approach is based on the market conditions and uses variables like market prices and and various valuation multiples. It can be used when there is limited information about the target company and absolute valuation process is not so reliable.
- Widely accepted – The process is easily accepted and used in the financial market. Investors and analysts can easily use, interpret and communicate it so that the results can be compared.
- Market sentiments – It reflects the sentiments of all market participants regarding a particular industry or the sector. The perception of the market is reflected in the company valuation which also shows the potential growth and expansion opportunity of the future.
- A benchmark – the target company can be assumed as the benchmark to compare with other peers in terms of financial strength and performance, valuation metrics and growth prospects.
- Quick analysis – The comparison and analysis does not take much time, especially is sufficient information about the comparable companies are available. There is no need of complicated financial modelling techniques or huge data collection.
Cons
Some of the cons of the process are as given below:
- Company selection- The selection of comparable companies is not an easy task. They should be of similar size, growth prospects and business model. This task can be challenging and ay provide results that may not be accurate.
- Difference in financial reporting- The financial data reported by companies may not always be reliable and accurate. Thus, eve though they may be similar in many aspects, the companies cannot be compared. There may also be differences in accounting policies.
- Incomplete information – This can also hinder the process of comparison and lead to error in analysis and decision making, because they do not provide a comprehensive view of the financial and operational performance.
- Market inefficiencies – The market participants can show some bias towards market price and valuation of certain companies, or there may be some engetive news about a company, leading to misinterpretation and distortion of the financial results. This makes comparison difficult.
Comparable Company Analysis Vs Precedent Transaction Analysis
The above are two very commonly used techniques for valuation in the financial market. While both are for valuation purpose, the approaches are different. Let us look at the differences between them.
- The former refers to comparison of the target company with companies of similar nature in terms of financial valuation and market performance, whereas the latter involves use of past data of similar companies which bought or sold.
- The former uses data like market price and capitalization, industry size, growth prospects etc where the latter uses perchase price, type of deal, financial metrics, etc.
- The valuation multiples for the former are price to earnings ratio, price to sales ratio, EV/EBITDA, etc but for the latter, acquisition price to earnings, enterprise, etc.
- The former reflects the market sentiments and is widely accepted and easy to interpret. But the latter considers company specific factors.
- The former relies of suitable company selection which may involve market inefficiencies and bias. But the latter relies on assumptions of past transactions whose data may not be properly available or distorted leading to error in comparison.
Thus the above are some important differences between the above two concepts.
Frequently Asked Questions (FAQs)
Why use comparable company analysis?
The comparable analysis employs ratios such as enterprise value to revenue or EBITDA to facilitate company comparison. These ratios ensure the data is presented uniformly and comprehensibly for each company.
What is the difference between DCF and comparable company analysis?
When using the DCF model, predicting future dividends or free cash flows appropriately is essential. In contrast, the comparables method requires a fair and comparable peer group or industry. This model is based on the idea that similar goods should be sold at similar prices, meaning that equal revenues from identical sources should also have similar prices.
What are the assumptions of comparable company analysis?
A comparable company analysis assumes that companies of similar size, industry, and prestige will be valued similarly.
Can Comparable Company Analysis be used for any company?
CCA is commonly used for publicly traded companies since relevant financial data for comparison is readily available. However, it can also be used for private companies using industry reports, remote company databases, or other sources to obtain comparable financial information.
Recommended Articles
This article has been a guide to what is Comparable Company Analysis. We explain it with examples, excel template, pros & cons & how to do.