Excel Normal Distribution Graph (Bell Curve)
A normal distribution graph is a continuous probability function. We all know what probability is; it is a technique to calculate the occurrence of a phenomenon or a variable. A probability distribution is a function used to calculate a variable’s event. There are two types of probability distributions: discrete and continuous.
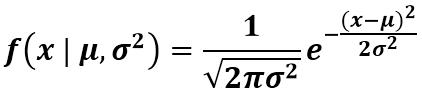
The basic idea of a normal distribution is explained in the overview above. By definition, a normal distribution means how evenly the data is distributed. A continuous probability distribution is used to calculate real-time occurrences of any phenomenon. In Mathematics, the equation for a probability distribution is as follows:
Seems so complex, right? But Excel has made it easier for us to calculate normal distribution as it has a built-in function in Excel of the normal distribution. So in any cell, we must type the following formula:
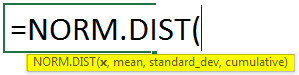
It has three basic factors to calculate the normal distribution in excel:
- X: X is the specified value for which we want to calculate the normal distribution.
- Mean: Mean is whereas average of the data.
- Standard_Dev: Standard deviation is a function to find the deviation of the data. (It has to be a positive number).
The graph we plot on this data is called a normal distribution graph. It is also known as a bell curve. What is the bell curve? A bell curve is a common distribution for a variable, i.e., how evenly a data is distributed. It has some. The chart we plot can be a line or scatter chart with smoothed lines.
How to Make a Normal Distribution Graph in Excel?
Below are the examples of normal distribution graphs in Excel (bell curve).
Normal Distribution Graph Example #1
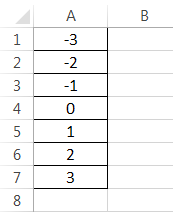
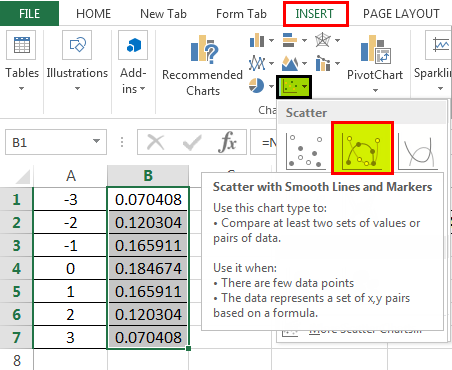
First, we will take random data. For example, in column A, let us take values from -3 to 3. Next, we need to calculate Excel’s mean and standard deviation in excel
before calculating the normal distribution. Then, we can make the Excel normal distribution graph.
So, have a look at the data below.
Follow the below steps:
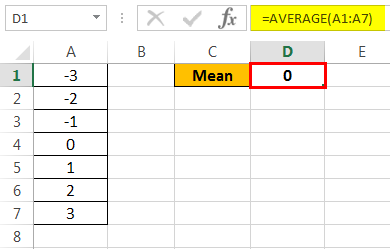
First, calculate the mean of the data, i.e., an average. Then, in cell D1, we must write the following formula.

Press the “Enter” key to get the result.

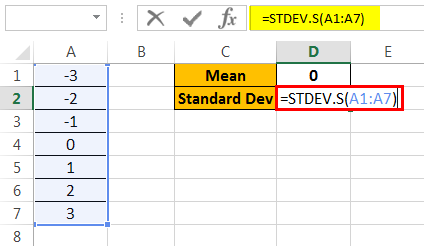
Now, we will calculate the standard deviation for the given data. So in cell D2, we must write the following formula.

Press the “Enter” key to get the result.

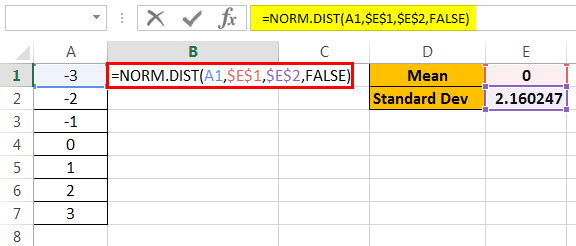
Now in cell B2, we will calculate the normal distribution by the built-in formula for Excel. Write down the following formula in cell B2.

The formula returns the result, as shown below:

Now, drag the formula to cell B7.

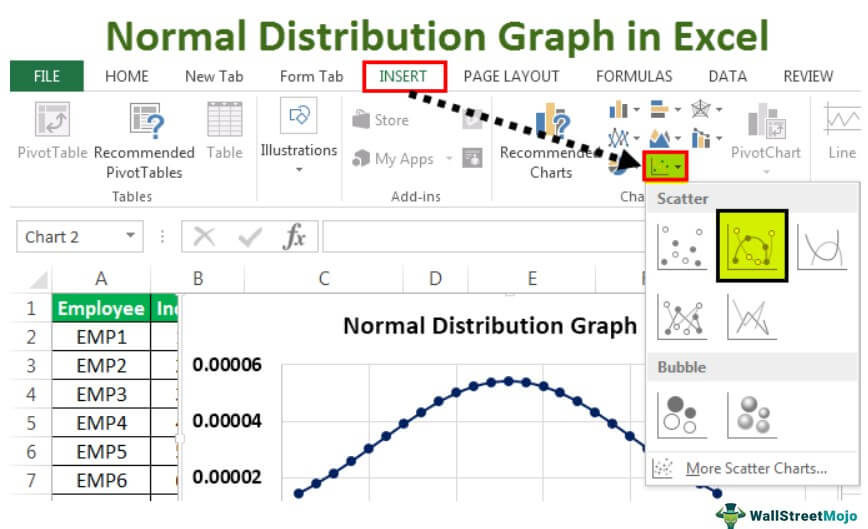
In cell B2, we have the normal distribution for the chosen data. To make a normal distribution graph, go to the “Insert” tab, and in “Charts,” select a “Scatter” chart with smoothed lines and markers.

When we insert the chart, we see that our bell curve or normal distribution graph is created.


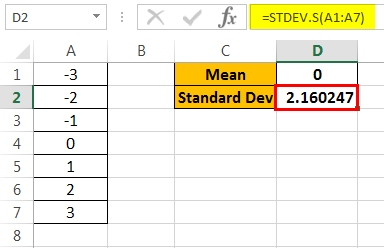

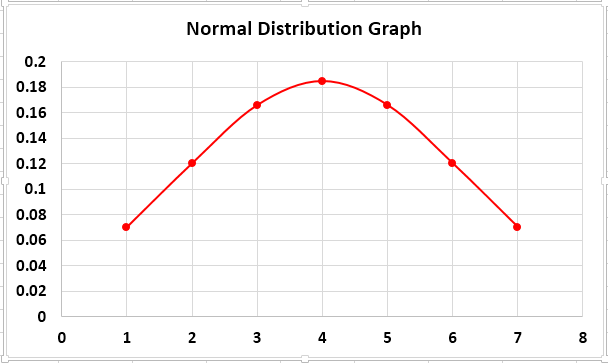
The above chart is the normal distribution graph for the random data we took. Now we need to understand something before moving on to a real-life example of data. Standard Deviation S means Standard Deviation Sample because we have a huge chunk of data in real data analysis, and we pick a sample of data from that to analyze.
Normal Distribution Graph Example #2
Moving on to a real-life example. The more the data we have, the smoother line we will get for our bell curve or Excel normal distribution graph. To prove that, we will take an example of employees and their incentives achieved for the current month. Let us take a sample of 25 employees.
Consider the below data.
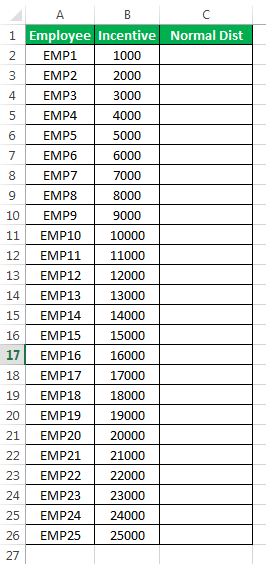
- The first step is calculating the mean, the average for the data in excel. Type the following formula for a mean.
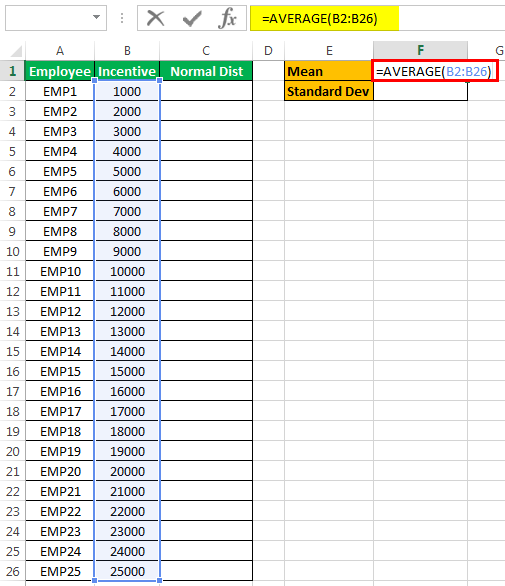
The mean of the data is 13,000.

- Now, let us find the standard deviation for the data. Type the following formula.
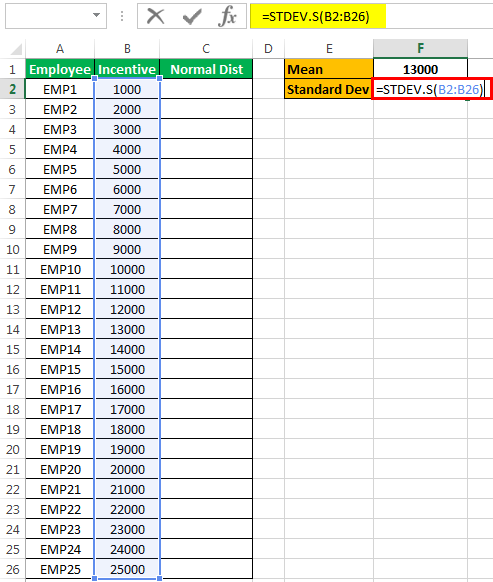
The standard deviation for the data is 7359.801.
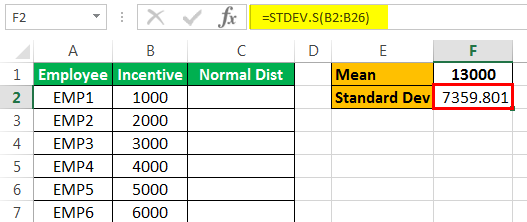
- As we have calculated both the mean and the standard deviation, we can now calculate the normal distribution for the data. Type the following formula.

- The normal distribution function returns the result, as shown below:

- Next, drag the formula to cell B26.

- Now, as we have calculated our normal distribution, we can go ahead and create the bell curve of the normal distribution graph of the data. But, first, click on the “Scatter” chart with smoothed lines and markers in the “Insert” tab under the “Charts” section.

- When we click “OK,” we see the following chart created:

We took 25 employees as the sample data. We can see that on the horizontal axis, the curve stops at 25.
The above chart was the normal distribution graph or bell curve for the data for employees and the incentives they achieved for the current month.
Excel normal distribution is a data analysis process requiring few functions, such as the mean and standard deviation of the data. The graph on the normal distribution is known as the normal distribution graph or the bell curve.
Things to Remember About Normal Distribution Graph in Excel
- The mean is the average of data.
- The standard deviation should be positive.
- The horizontal axis represents the sample count we picked for our data.
- The normal distribution is also known as the bell curve in Excel.
Recommended Articles
This article is a guide to the Normal Distribution Graph in Excel. We look at creating a normal distribution graph in Excel with a downloadable Excel template. You may learn more about Excel from the following articles: –