What Are Excel 3D Maps?
3D Maps in Excel are a new feature provided by Excel in its latest versions of 2016. It introduces map elements in the Excel graph axis in three dimensions, like an actual functional map.
In Excel 3D Maps, we represent the data on a globe that can either be international or on smaller scales. Therefore, it is dependent on the type of data.
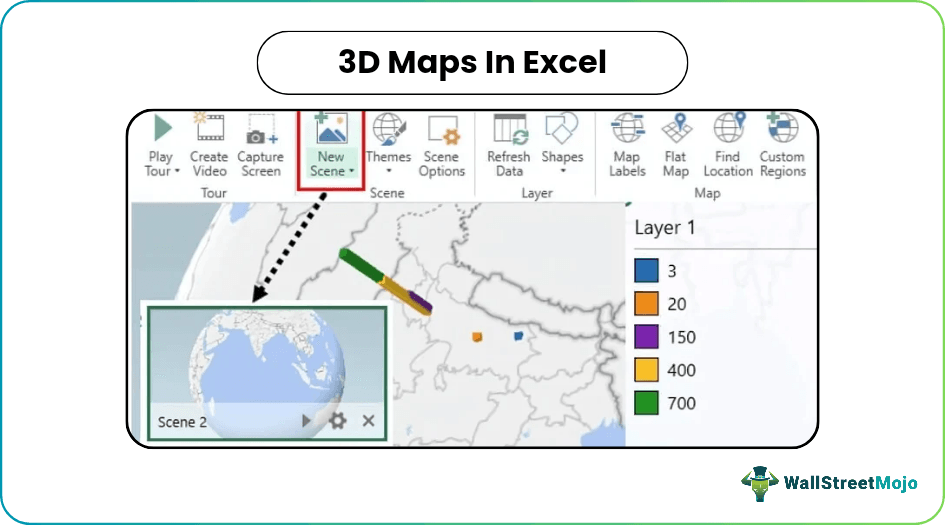
For example, we can create a 3D Map with color coding for different dimensions or layers, as shown in the image below.
Key Takeaways
- 3D Maps in Excel is a feature to represent large data, such as the comparison of population between different countries or regions, and geographical details, in the form of Maps & Globes.
- The Excel 3D Maps introduced in Excel 2016 are inbuilt in the same version and above. We can use it in Excel 2013 by downloading it from the Microsoft Website, or enabling the “Power Maps” Add-in.
- These three-dimensional Maps are used to demonstrate data in location format. Also, we can custom images or global maps provided by Excel to represent the data.
How To Use 3D Maps In Excel?
We can use 3D Maps in Excel as follows,
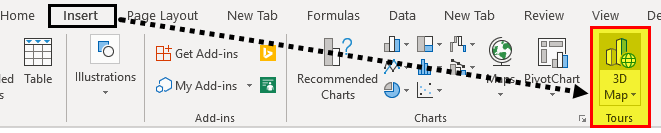
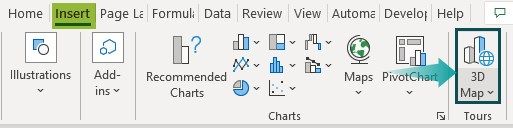
First, choose the dataset – select the “Insert” tab – go to the “Tours” group – click the “3D Map” option drop-down – select the “Open 3D Maps” option, as shown below.
Examples
We will consider some examples to create 3D Maps in Excel.
Example #1
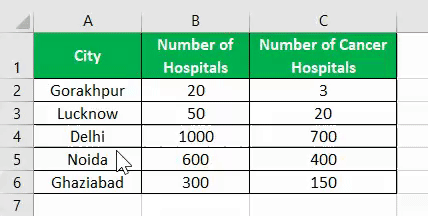
Let us consider the following data.
Here, we have city names of different locations, the total number of hospitals available in each city, and how many hospitals are where cancer is treated. Now, we will plot this data on a 3D Map using the 3D Map feature provided by Excel.
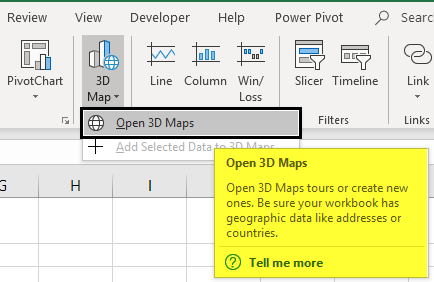
First, select the data we need to plot.

In the “Insert” tab, click on “3D Map” under the “Tours” category.

A dialog box opens up, like the one below.

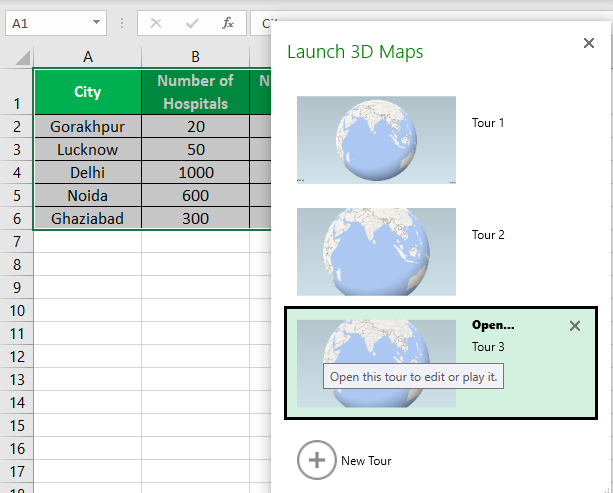
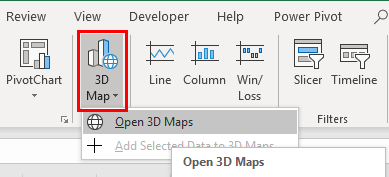
Click on Open 3D Maps, and we see another set of options.

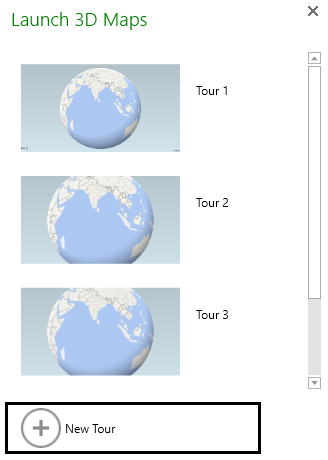
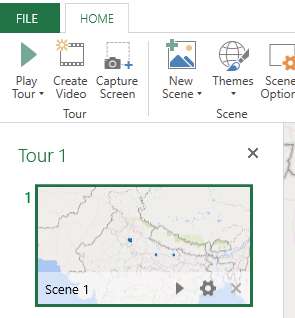
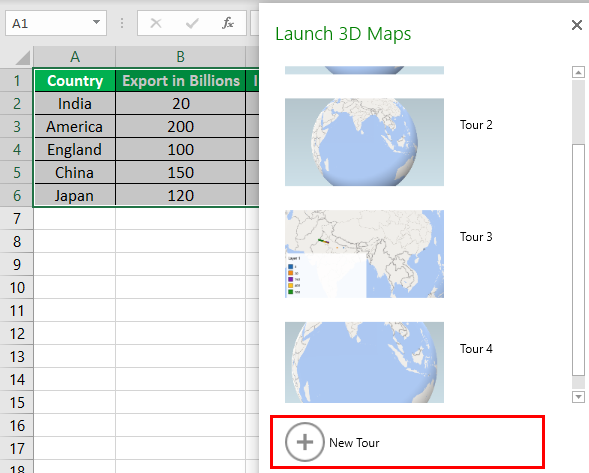
We already have a few open in my Excel file, which shows some additional tours. But first, we must click on the “New Tour” button provided.

We must wait for some time, then another window pops up that looks like shown.

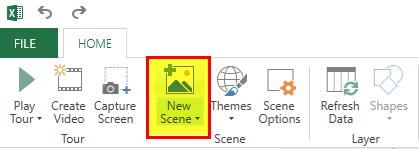
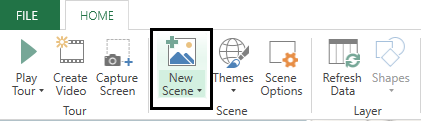
Click the “New Scene” in the “Scene” tab provided.

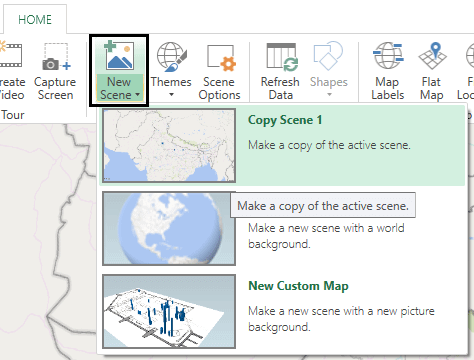
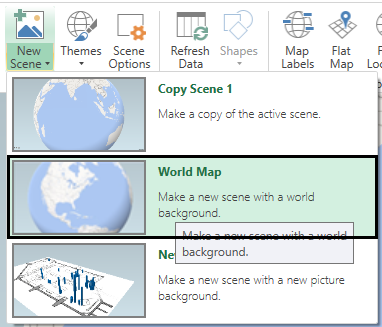
It provides us with three options. We can choose any one of them.

Let us choose the first one, which is copy scene 1. Then, we can see a box for the scene on the window’s left-hand side.

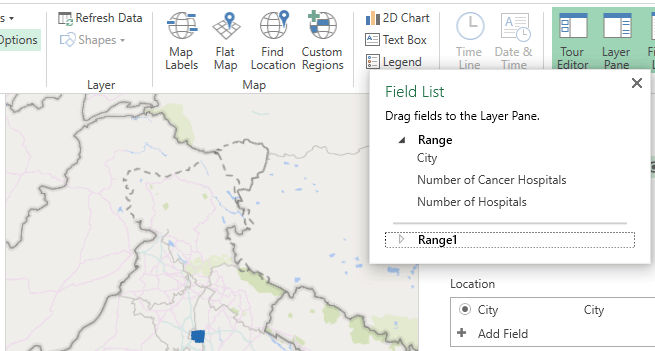
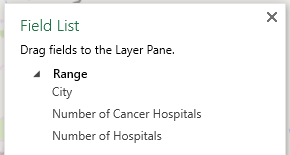
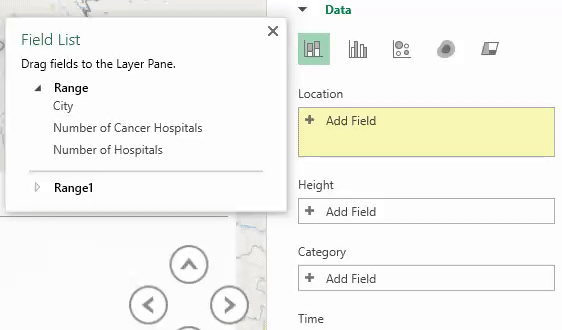
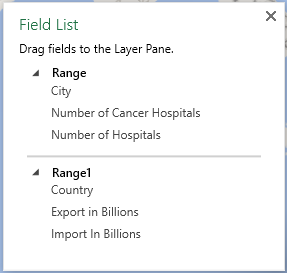
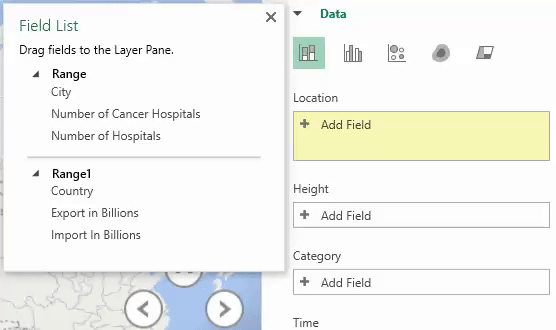
Now, we have different field lists, as we saw in the raw data above, displayed on the right-hand side of the window.

Drag the column headers in the respective fields. First, drag the city into – Location.
Now, drag several hospitals in the heights section. The number of cancer hospitals has been dragged to the category field.

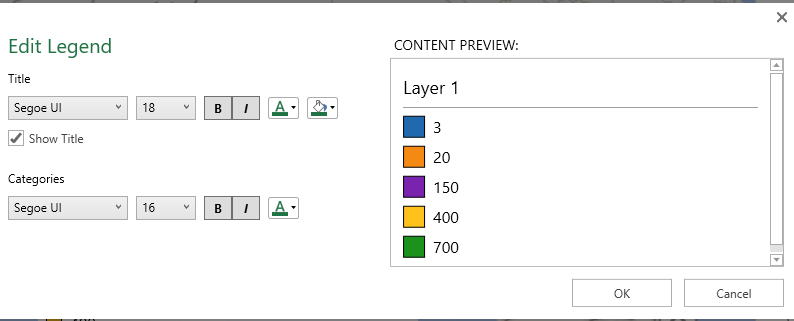
While we make these changes, we see that the Legend entry is changing.

Now, our 3D Map for the above data is generated, as shown below.


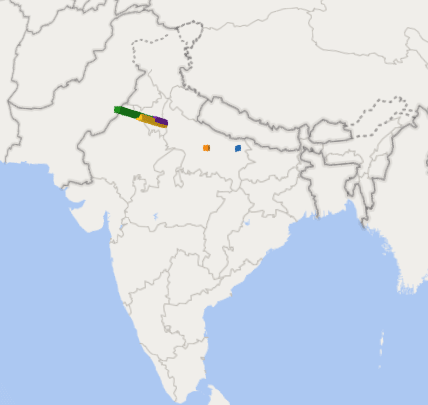
We can make specific changes in the 3D Map to our requirements.
Example #2
The above data we took was on a smaller scale. Now, let us look at the data on a bigger scale, i.e., on the international level. First, have a look at the below information.
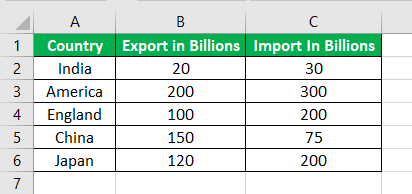
We have the above data for five countries to import and export revenues for the current year. We will represent this data in a geographical globe, as shown in the following steps:
- Step 1 – We first must select the data to give ranges to the 3D Maps.

- Step 2 – Now, in the “Insert” tab under the tours section, click on “3D Map.”
- Step 3 – A wizard box opens for 3D Maps, giving us two options.
- Step 4 – Click “Open 3D Maps.” We can see that different templates have been created earlier. Click on the “New Tour.”
- Step 5 – Click on the “New Scene” from the scenes button.
- Step 6 – It will provide us with three options. First, we will choose the “World Map” as it is international data.
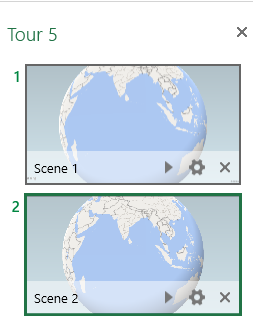
- Step 7 – On the left-hand side, we see that scene two is created for us.
- Step 8 – We have our field lists on the right-hand side. Drag each one of them in the order.
(Note: The range for previous data is also visible as this map is created in the same workbook).
- Step 9 – Drag the country to the location box.
- Step 10 – Now, drag export and import billions of data to category and height, respectively.
- Step 11 – Now, we can see that the 3D Map for the above data has been created around the globe.
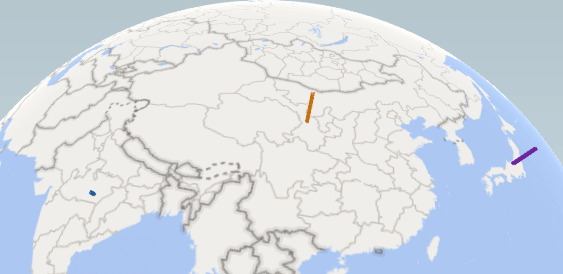
We can also hover our mouse to see the different parts of the globe and the various data values. We can make changes to the axis or data, and click on refresh data to see the changes in the map as per our requirements.
Important Things To Note
- The 3D Maps are not available in the earlier versions than Excel 2013.
- One can use it for more minor scales of data, on a bigger scale, or an international scale.
Frequently Asked Questions (FAQs)
What is the purpose of 3D Maps in Excel?
The 3D Maps in Excel help users to graphically visualize the country or region-wise data. w.r.t population or any other category in an organized, arranged manner. It is useful when we have to showcase huge data which cannot be done using normal graphs.
How to insert 3D Maps in Excel?
We can use 3D Maps in Excel as follows,
First, choose the cell range – select the “Insert” tab – go to the “Tours” group – click the “3D Map” option drop-down – select the “Open 3D Maps” option, as shown below.
3D Maps in Excel are not found or not working.
A few reasons why 3D Maps in Excel may not work are,
- The Excel version we are using maybe below 2013, as it was introduced in the 2016 version.
- The “Power Map add-in” is not enabled in MS Excel. We can enable as follows,
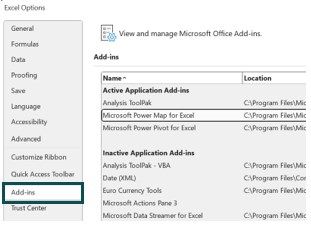
- Select the “File” tab – “Options”, to open the “Excel Options” window.
- In the “Excel Options” window, choose “Add-Ins” on the left and the “Microsoft Power Map for Excel” on the right, as shown below.
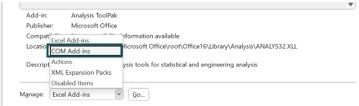
- Then, in the window below, choose the “COM Add-ins” from the “Manage:” field drop-down, and click the “Go…” option, as shown below.
- Finally, the “COM Add-ins” dialog box opens. Check/tick the “Microsoft Power Map for Excel” checkbox, and click “OK”, to close the dialog box.
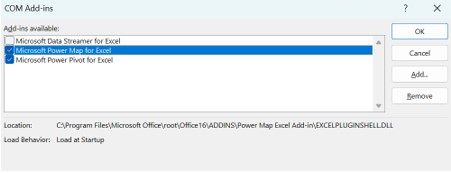
- Once again, click “OK” to close the “Excel Options” window.
Thus, the 3D Maps are enabled to use.
Recommended Articles
This article is a guide to 3D Maps in Excel. Here, we learn to create 3D Maps, in Excel 2016, 2013 & earlier versions, examples & downloadable excel template. You may learn more about excel from the following articles: –