Part of our Excel Charts guide
What Is Excel Box And Whisker Plot?
A box and whisker plot in Excel is an exploratory chart that shows statistical highlights and data set distribution. This chart is used to indicate a five-number summary of the data. These five-number summaries are “Minimum Value, First Quartile Value, Median Value, Third Quartile Value, and Maximum Value.” Using these statistics, we display the distribution of the dataset. Below is a detailed explanation of these statistics.
For example, suppose you have a data set and need to show data distribution into quartiles, highlighting the mean and outliers. In addition, we may use a box and whisker chart to compare and analyze statistically, e.g., medical results, test scores, etc.
Key Takeaways
- Excel’s box and whisker plot uses five statistical measures, including minimum, first quartile, median, third quartile, and maximum values, to summarize data distribution in detail.
- To get a better understanding of how your data is distributed, you can use Excel’s box and whisker plot.
- The box and whisker plot chart is only commonly used in the world of statistics, perhaps due to a lack of awareness among Excel users.
- Additionally, some users may need help understanding how to interpret the chart.
How To Create A Box And Whisker Plot In Excel?
Box and whisker plot in Excel requires 5 important values. They are:
- Minimum Value: The minimum or smallest value from the dataset.
- First Quartile Value: The value between the minimum and median values.
- Median Value: Median is the middle value of the dataset.
- Third Quartile Value: The value between the median and maximum values.
- Maximum Value: The highest value of the dataset.
One of the problems with the box and whisker plot chart is that it is not familiar to use outside the statistical world may be due to a lack of awareness among its users in the Excel community. On the other hand, it could also be the reason for the lack of knowledge on interpretation of the chart.
Let us learn how to create box and whisker plots in Excel with detailed following examples.
Examples
Example #1
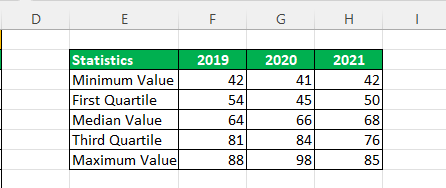
For a better explanation of the box and whisker plot chart with Excel, we are taking the sample data of the examination of the previous 3 years. Below is some data.
We must first calculate the five statistics numbers from the above data or each year for each year. Five numbers of statistics are “Minimum Value, First Quartile Value, Median Value, Third Quartile Value, and Maximum Value.”
For this, create a table like the one below.

First, we must calculate the “Minimum Value” for each year.
Then, we need to calculate the “First Quartile Value.”
Then, we will calculate the “Median Value.”

Next, we should calculate the “Third Quartile” value.
Then, the final statistics are the “Maximum Value” from the loss.

Now, we have completed performing the five number statistics. However, we need to create one more similar table to find the differences. We need to retain only the minimum value as it is.
To find the difference for “First Quartile” is First Quartile – Minimum Value.”
To find the difference for “Median Value” is “Median Value – First Quartile.”

To find the difference for the “Third Quartile” is “Third Quartile – Median Value.”

To find the difference for “Maximum Value” is the “Maximum Value – Third Quartile.”
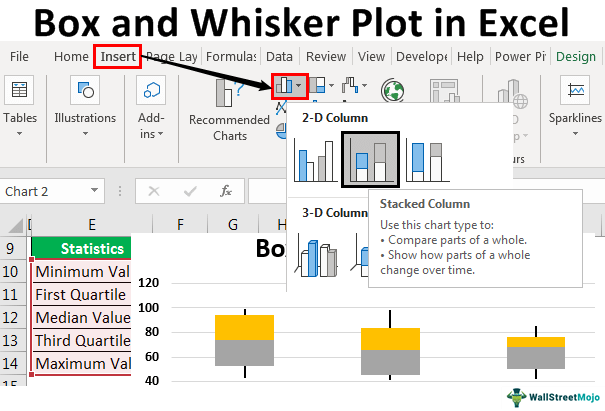
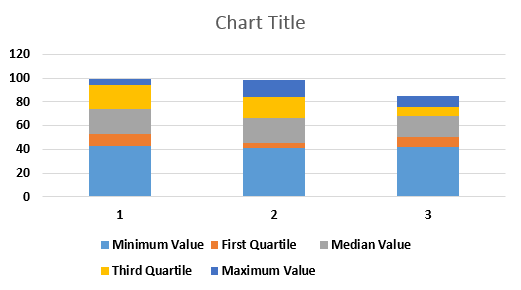
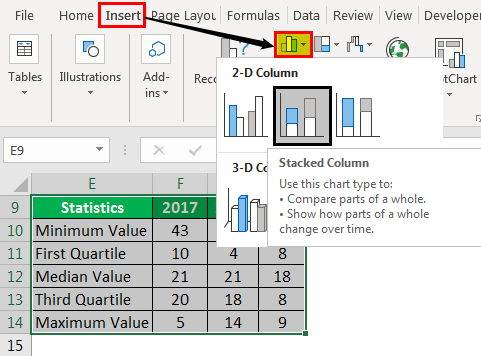
Our final table is ready to insert a chart for the data. Now select the data to Insert Stacked Column Chart in Excel.

Now, we will have a chart like the one below.

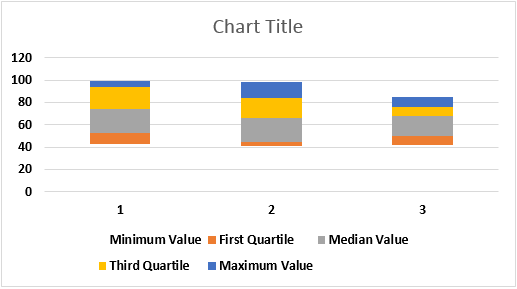
We must select the data under the “Design Ribbon” and select “Switch Row / Column.”

Our rows and column data in the chart are switched, so our modified chart may look as follows.
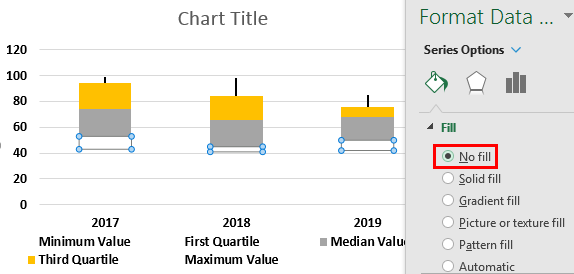
We will select the bottom-placed bar, i.e., the blue-colored bar, and make the fill “No Fill.”

Therefore, now, the bottom bar is not visible in the chart.
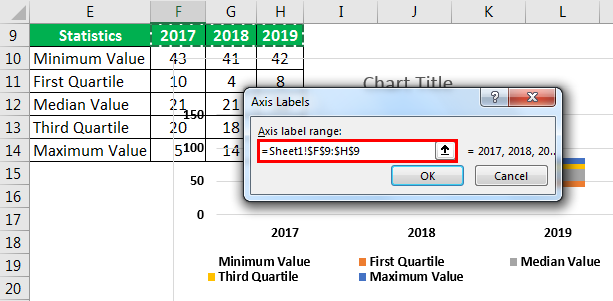
Now, change the horizontal axis labels to 2017, 2018, and 2019.
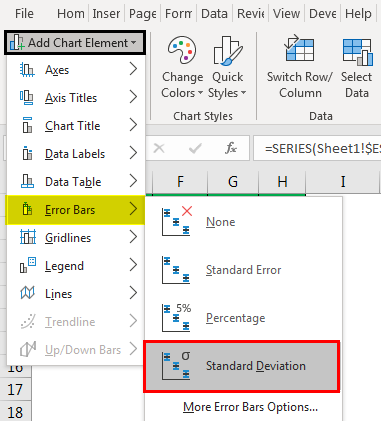
The box chart is ready. Next, we need to create a whisker for these boxes. Now, selecting the top bar of the chart will make no fill.

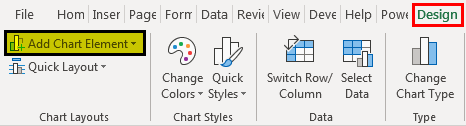
We will go to the “Design” tab and “Add Chart Elements” by
selecting the same bar.

Under “Add Chart Elements,” click on “Error Bars – Standard Deviation.”
Now, we have whisker lines on top of the bars.
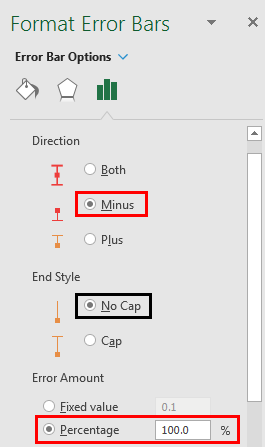
Now select newly inserted Whisker lines and click “Ctrl + 1” to open the format data series option to the right of the chart.
Under Format Error Bars” we need to make the following changes.
>>> Direction “Minus”
>>> End Style “No Cap”.
>>> Error Amount > Percentage > 100%.

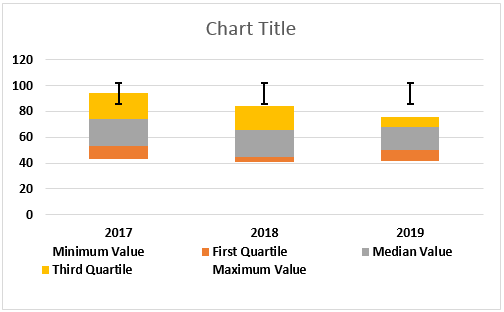
Now, the whisker lines will look as shown below:
We will select the bottom-placed bar and make the fill “No Fill.”

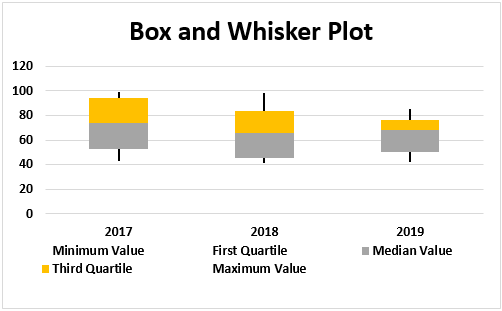
Then, we would follow the same steps as above to add the whisker line at the bottom of the box. So now our box and whisker Excel chart will look as follows.
Example #2
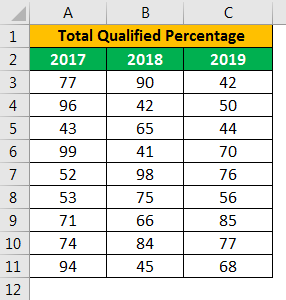
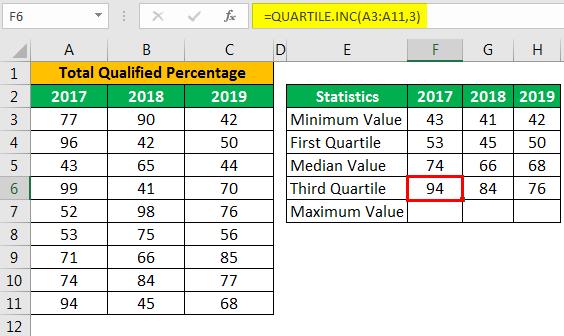
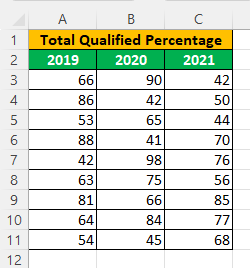
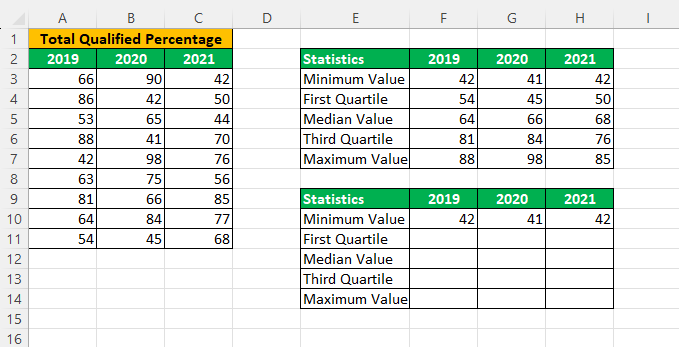
Consider the below table showing total qualified percentage in 2019, 2020 and 2021. Now let us learn how to create box and whisker plot in Excel.
We must first calculate the five statistics numbers from the above data or each year for each year. Five numbers of statistics are “Minimum Value, First Quartile Value, Median Value, Third Quartile Value, and Maximum Value.”
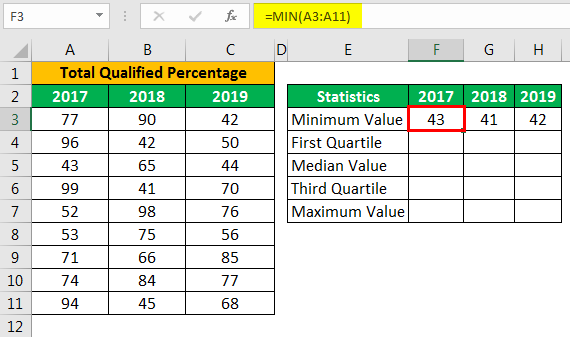
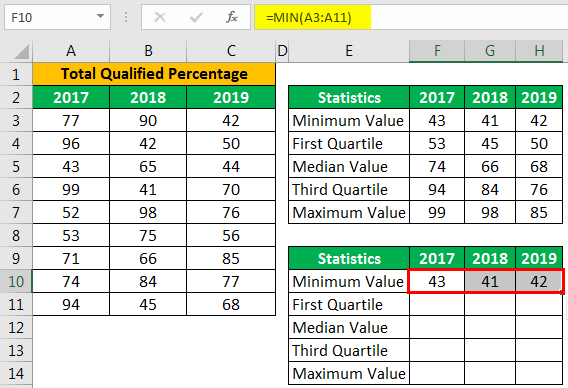
For this, create a table and calculate the “Minimum Value” for each year using the formula, =MIN(A3:A11).
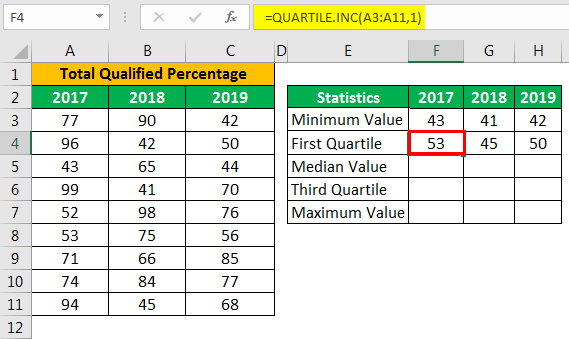
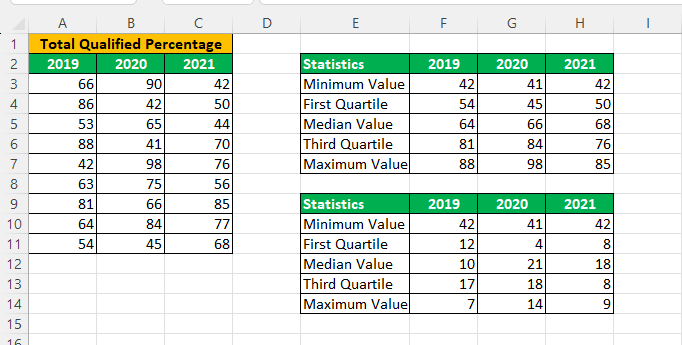
Next, we need to calculate the “First Quartile Value” using the formula =QUARTILE.INC(A3:A11,1)
Then, we should calculate the “Median Value” using the formula, =QUARTILE.INC(A3:A11,2)
Then, we should calculate the “Third Quartile” value using the formula, =QUARTILE.INC(A3:A11,3)
Finally, we should find the “Maximum Value” from the loss, using the formula, =MAX(A3:A11)
Now, we have completed performing the five number statistics. However, we need to create one more similar table to find the differences. We need to retain only the minimum value as it is.
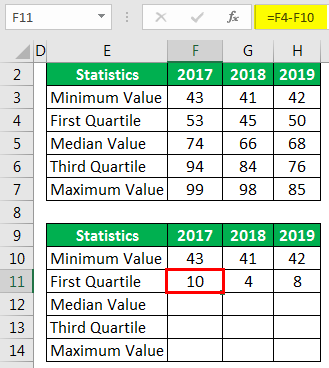
To find the difference for “First Quartile”, the formula is First Quartile – Minimum Value.”
To find the difference for “Median Value”, the formula is “Median Value – First Quartile.”
To find the difference for the “Third Quartile”, the formula is “Third Quartile – Median Value.”
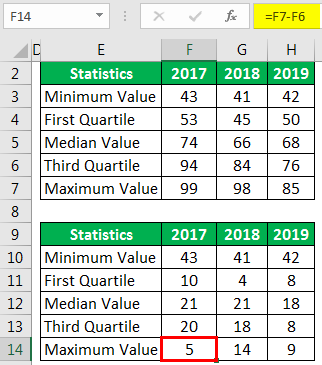
To find the difference for “Maximum Value”, the formula is “Maximum Value – Third Quartile.”
Our final table is ready to insert a chart for the data. Now select the data to insert the stacked column chart in Excel.
We must select the data under the “Design Ribbon” and select “Switch Row / Column.”

Our rows and column data in the chart are switched.
We will select the bottom-placed bar, i.e., the blue-colored bar, and make the fill “No Fill.”
Therefore, now, the bottom bar is not visible in the chart.
Now, change the horizontal axis labels to 2017, 2018, and 2019.
The box chart is ready. Next, we need to create a whisker for these boxes. Now, selecting the top bar of the chart will make no fill.
We will go to the “Design” tab and “Add Chart Elements” by
selecting the same bar.
Under “Add Chart Elements,” click on “Error Bars – Standard Deviation.”

Now, we will get whisker lines on top of the bars.
Next, select newly inserted Whisker lines and click “Ctrl + 1” to open the format data series option to the right of the chart.
Under “Format Error Bars,” we need to make the following changes.
>>> Direction “Minus”
>>> End Style “No Cap”.
>>> Error Amount > Percentage > 100%.
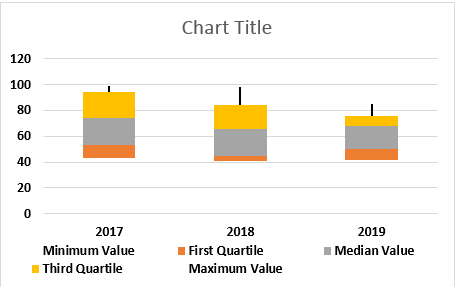
Now, the whisker lines will appear.
We will select the bottom-placed bar and make the fill “No Fill.”
Then, we would follow the same steps as above to add the whisker line at the bottom of the box. So now our box and whisker Excel chart will look as follows.

Likewise, we can create box and whisker plot in Excel.
Uses Of Box And Whisker Plot In Excel
- Box and whisker plot in Excel is used to represent the data in a graph, summarizing a set of data.
- Also, it portrays the distribution of data over a period of time.
- This chart is used by schools, classrooms or game boards to show the test scores.
Important Things To Note
- Box and whisker plot in Excel was first used by John Wilder Tukey.
- It is not a in-built plot but with use of simple statistical functions, we can create box and whisker plot in Excel.
- It requires Minimum Value, First Quartile Value, Median Value, Third Quartile Value, Maximum Value.
Frequently Asked Questions (FAQs)
How do you increase the spacing between boxes and whisker plots in Excel?
Open the ‘Format Data Series’ pane by right-clicking on one of the boxes on the chart. You can adjust the spacing of the gap between the boxes by increasing or decreasing the gap width.
What is a parallel box and whisker plot?
Parallel box-and-whisker plots are a useful tool for comparing the five-number summaries of two or more data sets visually.
What are the advantages of box and whisker plot?
Box and whisker plots are an efficient and straightforward way to summarize data from various sources and display the outcomes in a single graph. They allow for easy comparison of data from different categories, making decision-making more effective.
Recommended Articles
This article has been a guide to box and whisker plots in Excel. We discussed creating a box and whisker plot chart in Excel, practical examples, and a downloadable Excel template. You may learn more about excel from the following articles: –