Part of our Excel Charts guide
How to Create a Venn Diagram in Excel? (2 Methods)
Below are the two methods to create a Venn diagram in Excel.
- Create a Venn Diagram using Excel Smart Art
- Create a Venn diagram using Excel Shapes
Now let us discuss each of the methods in detail along with an example
#1 Create a Venn Diagram Using Excel Smart Art
Follow the steps to create a Venn diagram in Excel.
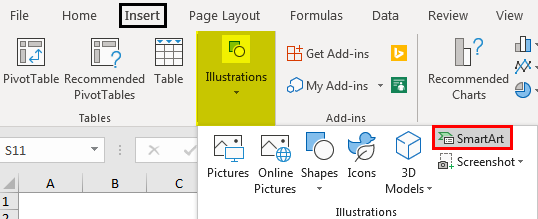
- We must first go to the “Insert” tab and click on “SmartArt.”
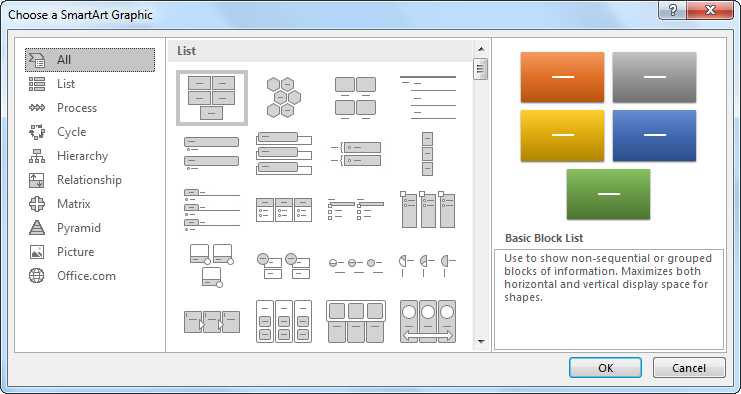
- Now, we can see the SmartArt window below.

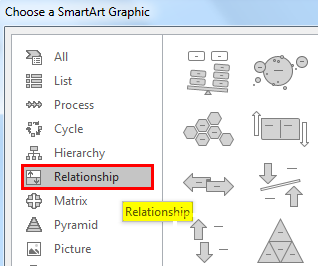
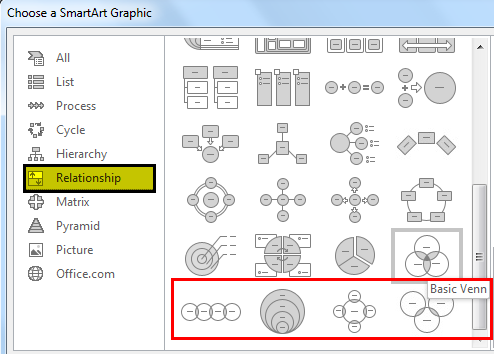
- Select the “Relationship” category.

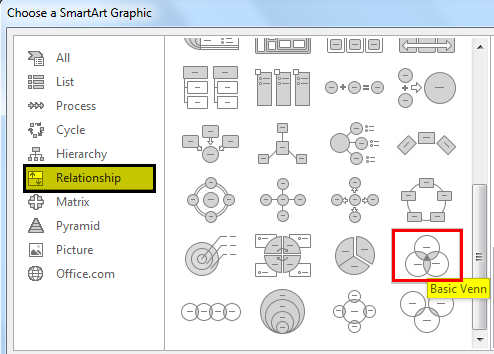
- After that, we must scroll down and select the “Basic Venn” diagram.

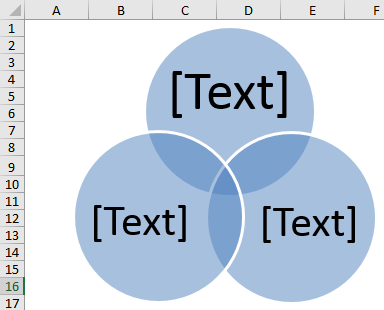
- Once the choice is made, we will now have the selection below the “Basic Venn” diagram.

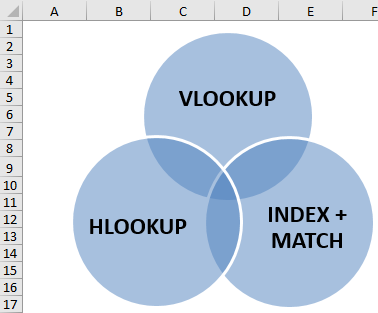
- Now, click on “Text” to enter the text as VLOOKUP,HLOOKUP, INDEX + MATCH.
This diagram shows that all three formulas belong to one category, LOOKUP functions.

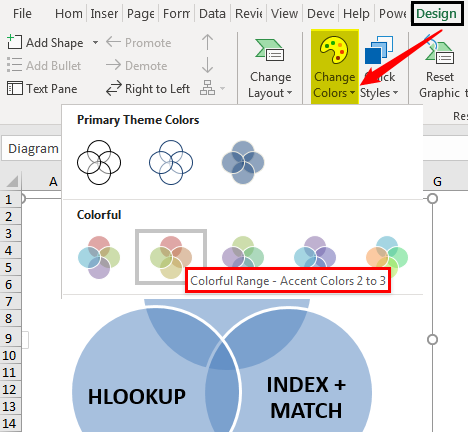
- Now, we can play around with the formatting of the smart art under the “Design” tab. First, click on the “Design” tab >> “Change Colors.”

- We can change the color as per our liking.


Like this, we have many Venn Diagram examples based on our requirements. We can choose different Venn diagrams.
#2 Create Venn Diagram Using Shapes in Excel
- Step 1: We must go to the Insert tab, click on “Illustrations,” and select “Shapes,” then choose “Oval” shape.

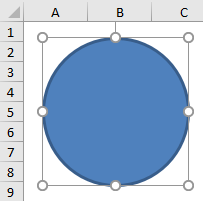
- Step 2: First, we must draw an oval shape.
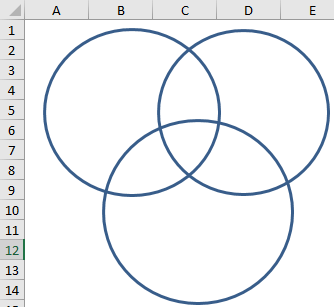
- Step 3: Like this, we can draw two more oval shapes in the form of a Venn diagram. And, make the “Fill” as “No Fill.”
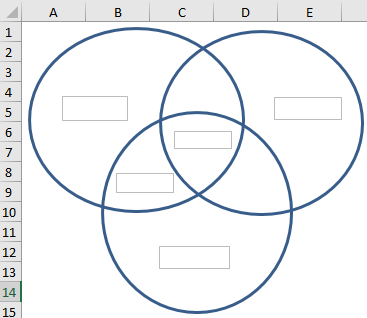
- Step 4: Now, we must insert “Text” boxes for each circle.
- Step 5: We have inserted 5 text boxes. In the first box, we must write “VLOOKUP.” In the second box, we must write “INDEX + MATCH.” Finally, in the third box, we must write “HLOOKUP.”
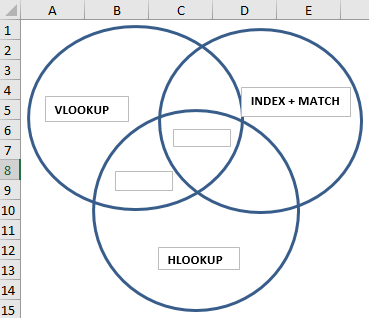
- Step 6: We have another two boxes. You must be wondering what we need to write with these boxes. In the middle text box, write “LOOKUP” functions, and in the other box, we must write “One Dimensional.”

- Step 7: From this diagram, we can interpret as there are three formulas: VLOOKUP, HLOOKUP, and INDEX + MATCH. All these are LOOKUP functions so related to each other.
The middle text box Lookup Function in excel belongs to all the circles.
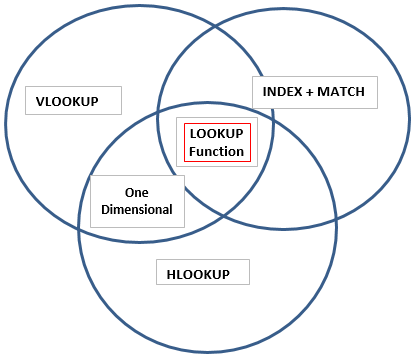
Then we have one more box which says “One Dimensional.” However, it applies only to the boxes “VLOOKUP” and “HLOOKUP.” So, this shows that the feature “One Dimensional” applies only to those two formula circles.
Like this, we can create a relationship between two or more similar things using Venn diagrams.
Things to Remember
- The built-in Venn diagram does not support all kinds of diagrams for relationship creation.
- For our own needs, we need to draw Venn diagrams through shapes.
- We can format shapes with different colors and sizes.
Recommended Articles
This article has been a guide to Venn Diagram in Excel. We discuss creating a Venn diagram using SmartArt and Shapes in Excel with examples and a downloadable Excel template. You may learn more about Excel from the following articles: –