Part of our Maths Functions in Excel guide
The Weighted Average Formulas of Excel
The generic weighted average formula is given as follows:
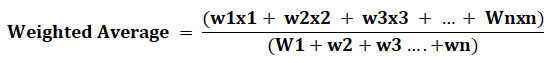
The letter “x” represents the numeric value, while “w” represents the relative weight in percentage (%). The weights need not always be in percentages. Moreover, the weights may or may not add up to 100%.
The SUMPRODUCT and SUM formula for calculating the weighted average is stated as follows:
“=SUMPRODUCT(numerical values,weights)/SUM(weights)”
The “numerical values” and “weights” can be cell ranges (arrays) or named ranges. Both these arguments should be supplied for calculating the weighted average.
Note 1: If all the numeric values are assigned equal weights, the weighted average in excel is equal to the simple average. In a simple average, all the numerical values of the dataset are treated equally.
Note 2: Both the preceding formulas can be used in Excel to calculate the weighted average. In the second formula, the SUMPRODUCT function shortens an otherwise lengthy numerator of the generic formula.
Moreover, use the denominator of the two preceding formulas when weights do not total up to 100%. In cases where weights add up to 100%, the division by the sum of weights is not required. This is because the sum of weights (or the denominator) equals to 1 in such cases.
The Procedure of Calculating the Weighted Average in Excel
Let us take a look at the procedure of calculating the weighted average in Excel. The entire procedure is explained step-by-step with the help of images. Every step is demonstrated by its corresponding image.
The steps for calculating the weighted average in excel are listed as follows:
- Create a table with the numeric values in one column and the corresponding weights in an adjacent column.

- Enter the SUMPRODUCT function in a cell. This multiplies the numeric values with the weights and sums up the resulting products.

- Enter the SUM function in another cell. This adds all the weights assigned to the different numeric values of the dataset.

- Divide the output of the SUMPRODUCT function with that of the SUM function. Perform this division in the cell in which the final output is required.

- The weighted average is obtained in the cell in which the outputs of the two functions (SUMPRODUCT and SUM) were divided.


Example #1–Weighted Average Using the Generic Formula
The following image shows certain numeric values in column A and weights in column B. We want to calculate the weighted average for the given dataset.
Use the generic weighted average formula (first formula under the heading “The Weighted Average Formulas of Excel” of this article).

The steps for calculating the weighted average with the generic excel formula are listed as follows:
Step 1: In any cell, say B8, enter the following formula.
“=A2*B2+A3*B3+A4*B4+A5*B5+A6*B6)/15”

Step 2: Press the “Enter” key and the output appears in cell B8. So, the weighted average is 38.33.
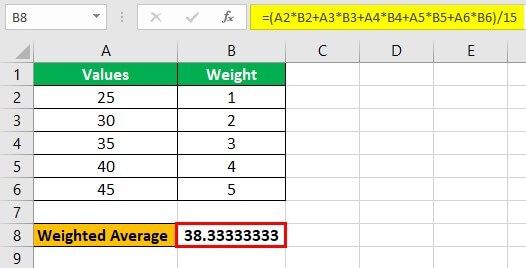
Explanation: In the formula entered in step 1, we have multiplied the individual entries (of columns A and B) and summed up the products. The resulting output is then divided by 15, which is the sum of all the weights (of column B). Hence, the final output is 38.33.
Since we did not use the SUMPRODUCT function (in step 1), we performed the multiplication and addition operations on columns A and B manually. However, had we used the SUMPRODUCT and SUM functions, the output would have been the same as obtained in the preceding step (step 2).
Example #2–Weighted Average to Evaluate the Performance of a Student
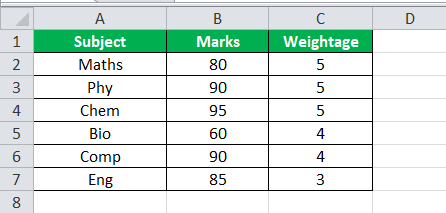
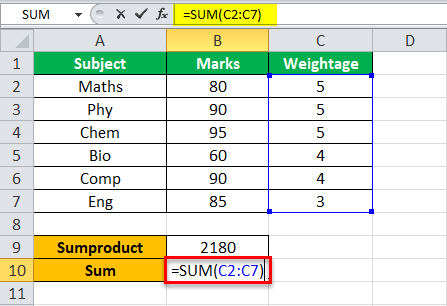
The following image shows the marks obtained (in column B) by a student in six subjects (in column A). These subjects are Mathematics (maths), Physics (phy), Chemistry (chem), Biology (bio), Computers (comp), and English (eng).
Further, the maximum marks of each subject are 100. Every subject has been assigned a weight (in column C) depending on its importance in the education system.
Perform the following tasks:
- Calculate the weighted average by using the SUMPRODUCT and SUM functions of Excel.
- Assess the performance of the student and state how the weighted average can be improved.
The steps to perform the given tasks are listed as follows:
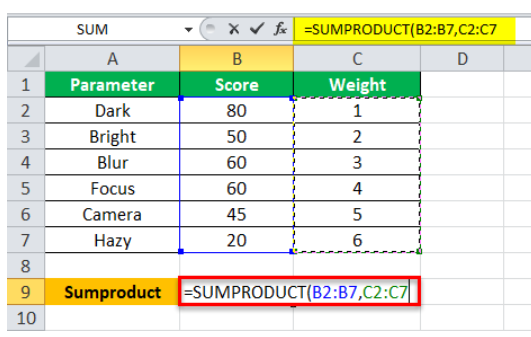
Step 1: Enter the following formula in cell B9.
“=SUMPRODUCT(B2:B7,C2:C7)”
The same is shown in the following image.

Step 2: Press the “Enter” key. The output of the SUMPRODUCT function is shown in the following image. Next, in cell B10, enter the following SUM formula.
“=SUM(C2:C7)”
Step 3: Press the “Enter” key. The output of the SUM function is 26, as shown in the following image. Further, enter the following division formula in cell B11.
“=B9/B10”
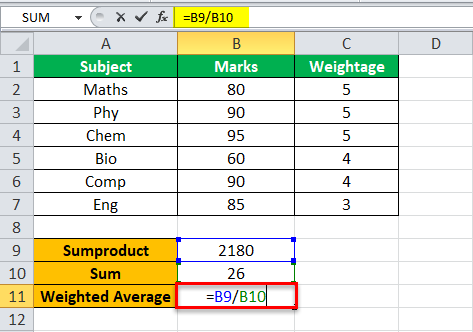
Step 4: Press the “Enter” key. The final output appears in cell B11. So, the weighted average is 83.846.
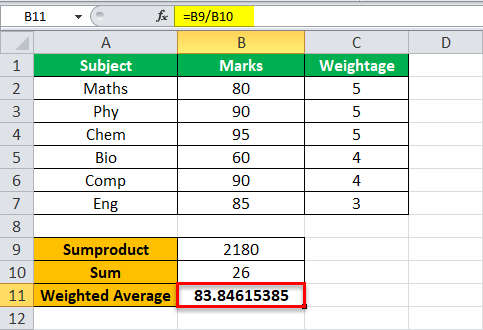
Explanation: The SUMPRODUCT function (step 1) multiplies the values of column B with the corresponding values of column C. It then adds the resulting products and returns 2180.
Likewise, the SUM function totals the weights and returns 26. So, 2180 divided by 26 equals to 83.846, which is the weighted average.
Assessment of performance: By looking at the weighted average (83.846), one can say that the student has performed fairly well in almost all the subjects. The score in Biology (60) is the lowest compared to the marks obtained in other subjects. However, this low score is offset by the high scores and higher weights of the subjects Mathematics, Physics, and Chemistry.
To improve the weighted average, the student must focus more on subjects having the highest weights (5). In addition, any progress in the marks of Biology can also increase the weighted average. This is because the weight of Biology (4) too is on the higher side.
Example #3–Weighted Average to Evaluate the Performance of an Employee
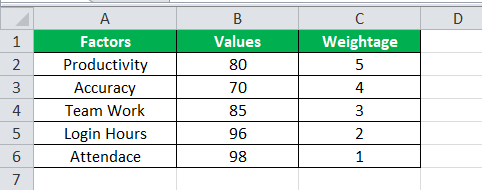
The following image shows the scores (out of 100 in column B) of an employee on five factors, namely, productivity, accuracy, teamwork, login hours, and attendance. Each factor has been assigned a weight (in column C) by the organization.
Perform the following tasks:
- Calculate the weighted average in Excel by using the SUMPRODUCT and SUM functions of Excel.
- Evaluate the performance of the employee and suggest the way the weighted average can improve.
- Show the impact on the weighted average by interchanging the score (or value) of the factor having the maximum weight with the one that has the minimum weight.
The steps to perform the given tasks are listed as follows:
Step 1: Enter the following SUMPRODUCT formula in cell B8.
“=SUMPRODUCT(B2:B6,C2:C6)”
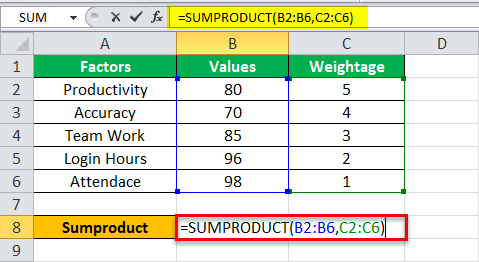
Step 2: Press the “Enter” key and the output is 1225, as shown in the succeeding image. Next, in cell B9, enter the following SUM formula.
“=SUM(C2:C6)”

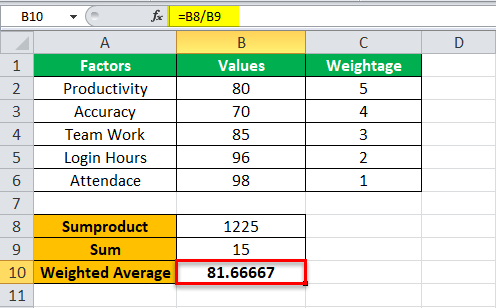
Step 3: Press the “Enter” key and the output of the SUM function is 15. Divide the output of the SUMPRODUCT function by that of the SUM function. For this, enter the following formula in cell B10:
“=B8/B9”
The same is shown in the following image.

Step 4: Press the “Enter” key. The weighted average is 81.66, as shown in the following image.
Explanation: The SUMPRODUCT function is applied on ranges B2:B6 and C2:C6 of the given dataset. So, the corresponding numbers of columns B and C are multiplied and the resulting products are added. This returns 1225.
The SUM function returns the sum of the weights (of column C), which is 15. The weighted average is obtained by dividing 1225 by 15. Hence, the weighted average is 81.66.
Assessment of performance: The performance of the employee is quite satisfactory on all factors. From all the given factors, attendance is the best scoring factor but has the least weight (1). Likewise, accuracy is the least scoring factor but has a high weight (4).
In order to improve the weighted average, the employee must focus more on productivity. This is because productivity is allotted the maximum weight (5). So, as productivity increases, the weighted average of the employee will increase considerably.
Likewise, there is a lot of scope for improvement on the accuracy factor. Any increase in the score of this factor can also help increase the weighted average to a great extent.
Impact on the weighted average: To study the impact on the weighted average, interchange the values (or scores) of productivity and attendance having the maximum and minimum weight respectively. The weights of column C remain the same (as given at the beginning of this example). This is shown in the succeeding image.
The weighted average has increased from 81.66 to 86.46. So, an increase of 22.5% in the value of productivity has increased the weighted average by 5.8%. This shows that a significant increase in the high-weight value has a fair increase on the weighted average.
Moreover, it can be said that productivity impacts the overall performance of the employee to the greatest extent. This is due to the allotment of the highest weight (5) to this factor.
Note: The higher the weight, the more the impact on the weighted average. Lesser the weight, lower the impact on the weighted average.

Frequently Asked Questions (FAQs)
Define the weighted average and state its formula used in Excel.
The weighted average is calculated in cases where numbers have been assigned different weights. Such weights reflect the relative importance of each number in the dataset. If equal weights are allotted to numbers, the weighted average is the same as the simple average.
The formula for calculating the weighted average in Excel is stated as follows:
“=SUMPRODUCT(numerical values,weights)/SUM(weights)”
The weighted average can also be calculated manually by multiplying the numbers with weights and adding the resulting products. The division with the sum of weights must be carried out in cases where weights do not add up to 100%
How to calculate the weighted average with percentages in Excel?
To use the concept of weighted average with percentages, let us calculate the weighted average return of three stocks A, B, and C. The individual returns of these stocks and the respective weights are given. Ignore the double quotation marks of the following dataset:
Column A
• Cell A1 contains “stocks.”
• Cell A2 contains “A.”
• Cell A3 contains “B.”
• Cell A4 contains “C.”
Column B
• Cell B1 contains “returns.”
• Cell B2 contains 30%.
• Cell B3 contains 75%.
• Cell B4 contains 60%.
Column C
• Cell C1 contains “weights.”
• Cell C2 contains 25%.
• Cell C3 contains 40%.
• Cell C4 contains 35%.
The steps for calculating the Excel weighted average with percentages are listed as follows:
a. Enter the SUMPRODUCT formula by defining two ranges which consist of numeric values and weights. So, we enter “=SUMPRODUCT(B2:B4,C2:C4)” in a blank cell. The first range (B2:B4) consists of individual returns of each stock. The second range (C2:C4) consists of the weights.
b. Press the “Enter” key.
The output is 0.585 or 58.5%. Hence, investing in the given proportion (weights) at the given rate of returns (in column B) yields a weighted average of 58.5%.
Note 1: Since the weights add to 100%, a division of the SUMPRODUCT formula (entered in step a) with the sum of weights is not required.
Note 2: If one performs manual calculations, it is a good idea to enter the percentages as decimal numbers. This eases the calculation process and improves the readability of the dataset. The final output obtained in such cases can either be retained as a decimal number or converted to a percentage.
How to calculate the weighted average in Excel when a criterion has been specified?
When a criterion is applied while calculating the weighted average, it is known as the conditional weighted average. This is computed by using the SUMPRODUCT function in the numerator and the SUMIF function in the denominator.
The formula for calculating the conditional weighted average in Excel is stated as follows:
“=SUMPRODUCT(- -(conditional array=“condition”),array1,array2)/SUMIF(conditional array,“condition,”array2)”
The arguments are explained as follows:
a. The unary operator or the double negative symbol (- -) converts the true and false values obtained (by applying the condition) into 1 and 0 respectively.
b. The “conditional array” is the array on which the condition is to be applied.
c. The “condition” is the criterion to be applied.
d. The “array1” and “array2” are the different arrays of the dataset. The “array1” represents the numerical values, while “array2” represents the weights.
The SUMPRODUCT function multiplies the true values (that meet the specified condition) of the conditional array with the corresponding values of “array1” and “array2.” The resulting products are then added by the SUMPRODUCT function.
The SUMIF applies the condition to the conditional array. For those values that meet the specified condition, it sums the corresponding values of “array2.”
The output of the SUMPRODUCT is divided by that of the SUMIF function to obtain the conditional weighted average.
Recommended Articles
This has been a guide to the weighted average in Excel. Here we discussed through examples, how to calculate the weighted average by using Excel formulas (SUM and SUMPRODUCT). You can download Excel templates from the website. Take a look at these useful functions in Excel–