Part of our Excel Charts guide
Excel Infographics
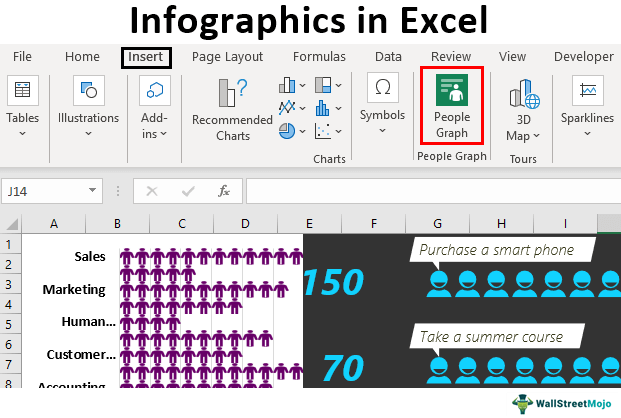
Infographics in Excel show the information or summary report through attractive charts, graphs, and images. In other words, infographics are the art of visualizing the data using external elements or ideas. They are different from dashboards and require the architectural mind to build your infographics in Excel.
How to Create People Graph Infographics in Excel?
Now, we will see some examples of creating infographics in Excel.
People Graph is the new additional feature available from Excel 2013 versions onwards. This graph is open with Excel 2013 onwards versions under the “INSERT” tab.
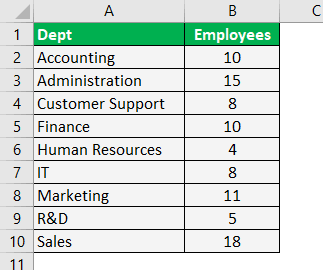
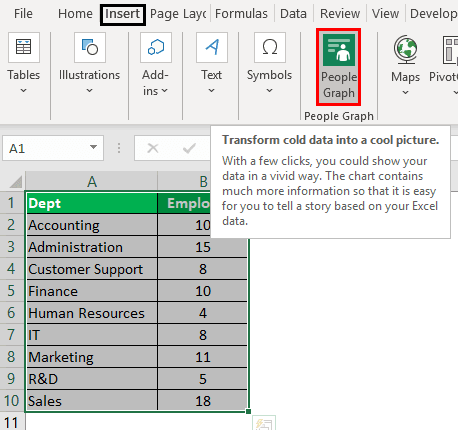
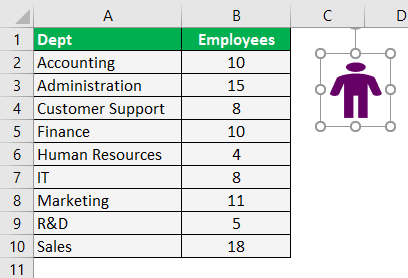
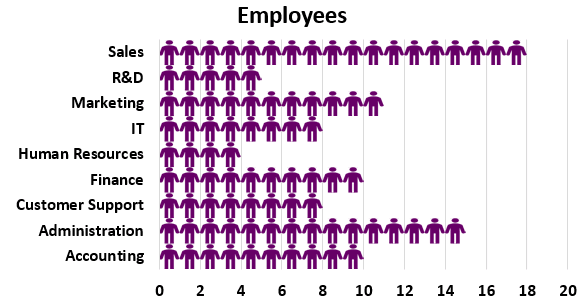
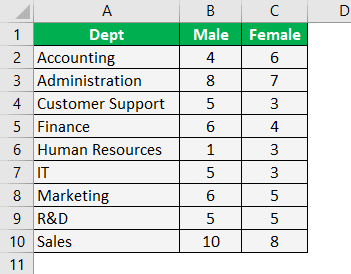
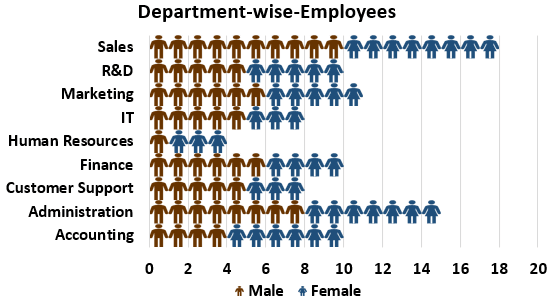
For example, below is an organization’s departmental workforce. We will show you how to create people graph infographics in Excel for this data.
The steps to create infographics in Excel are as follows:
- We must first copy the data to the Excel worksheet. Then, select the data to go to the Insert tab and click on People Graph.
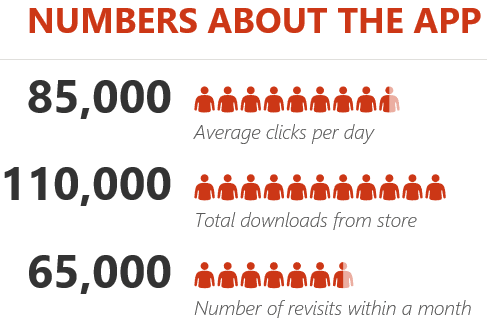
- First, it will show the numbers about the app.
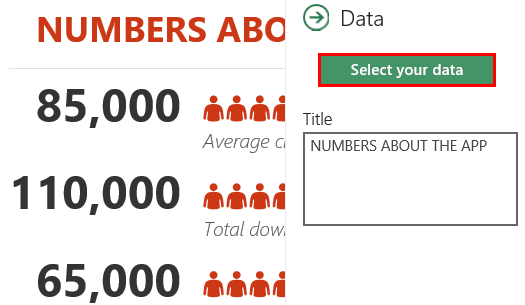
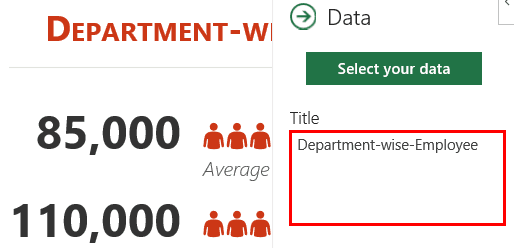
- Click on the “Data” icon at the top.
- Choose “Select Data”.
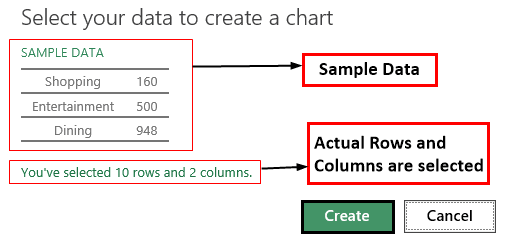
- Now, it will show a sample data preview, but it shows how many rows and columns in Excel are selected at the bottom. Now, we must click on Create to get the first People Graph.
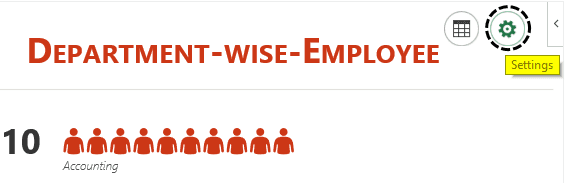
- We get the following People Graph.
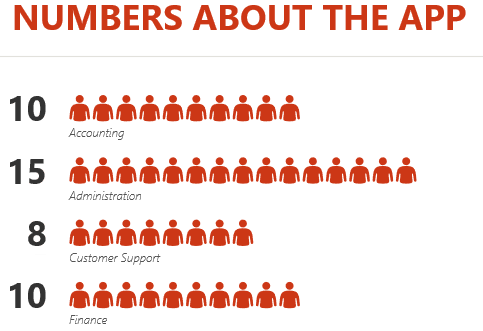
- Not all the departments are shown here. We need to expand the chart to see all the department data. From the data, the tab changes the title of the chart.
- Click on the “Settings” options to format the chart.
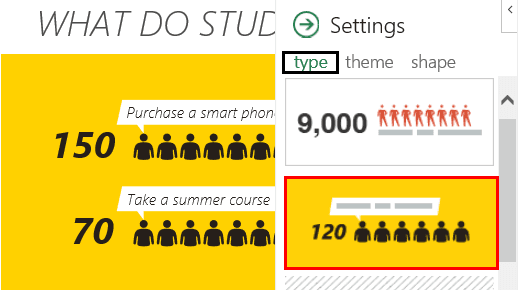
- In this “Settings,” we have three options: “Type,” “theme,” and “Shape.”
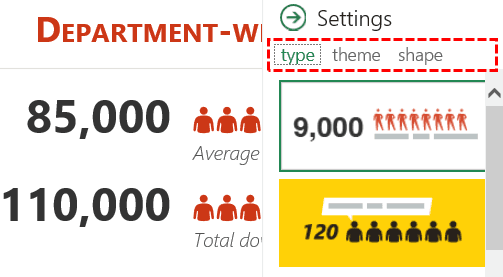
- From the “type,” we can choose a different kind of people graph.
- Under “theme,” we can change the color background of the chart.
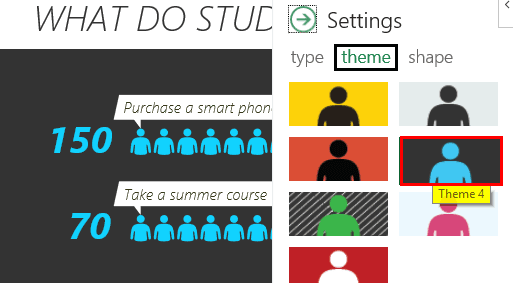
- Under “shape,” we can change the icons of the chart.
How to Use External Images to Create Infographics?
We have seen people graph infographics in Excel. We can also build infographics by using external images. We will use a human image from outside Excel for the same data.
We have downloaded the below human image from the internet into an Excel worksheet.
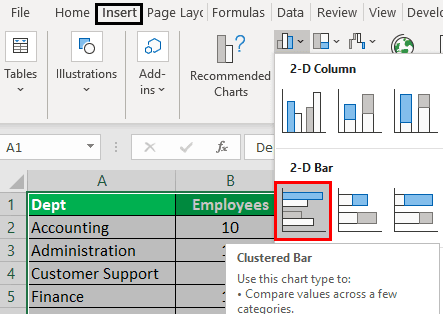
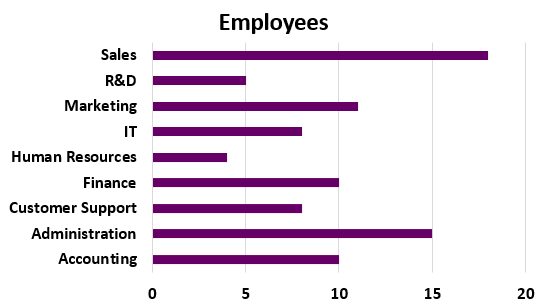
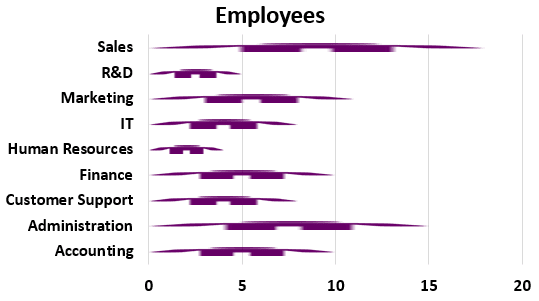
First, we must insert a bar chart in excel for the data.
Now, we have a chart like this.
We have to copy the human image >>> select the bar and paste it.
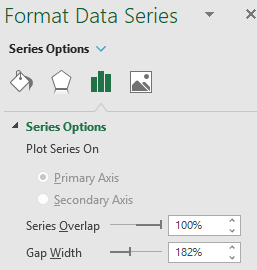
We need to format the chart to make it more beautiful. So, we must first select the bar and press “Ctrl + 1” to open the formatting tab to the right side.
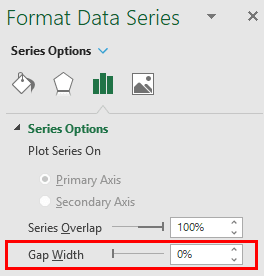
Make the “Gap Width” as 0%.
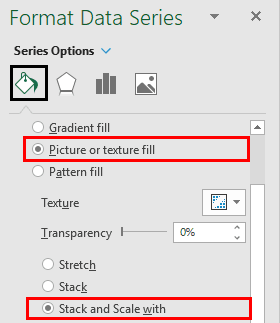
Now go to “Fill” and click on “Fill.”Make the fill as “Picture or Texture Fill” and check the option of “Stack and Scale Width.”
Now, our chart looks like this.
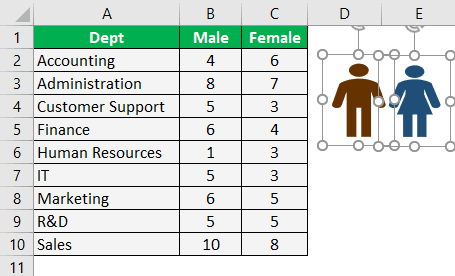
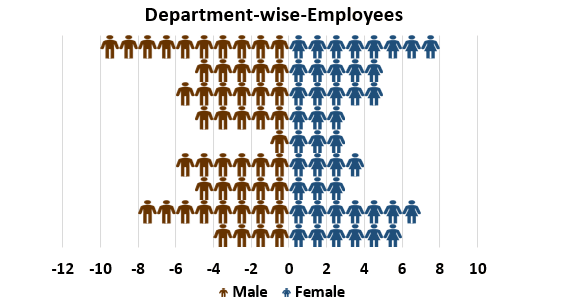
Now, assume we have a segregation of “Male” and “Female” employees.
We need to show male and female human images in the infographic chart. Therefore, we have downloaded male and female pictures from the internet.
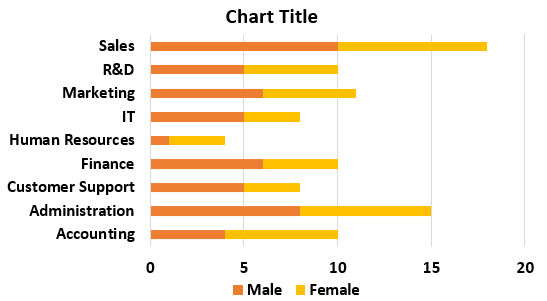
Then, we must select the data and insert the “Stacked Bar” chart.
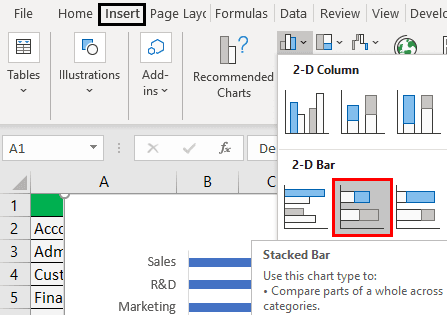
Now, we have a chart like this.
Copy the “Male” image and paste it on an orange-colored bar.
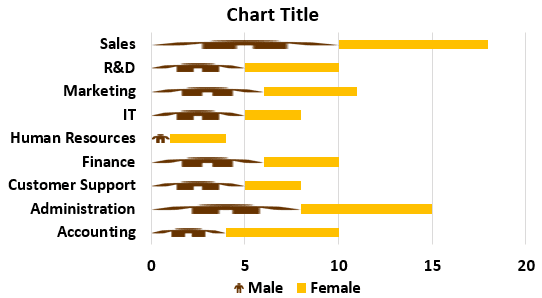
Copy the “Female” image and paste it on a yellow-colored bar.
Select the male bar and format the data series as we did in the previous example. We must repeat the same for the “Female” chart as well. We have segregation of “Male” and “Female” separately now.
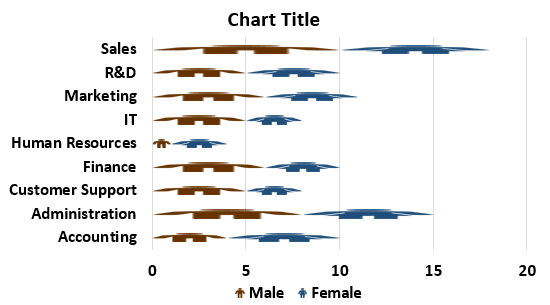
We can do one more thing to show male and female employees differently. We must arrange the data in the below manner.
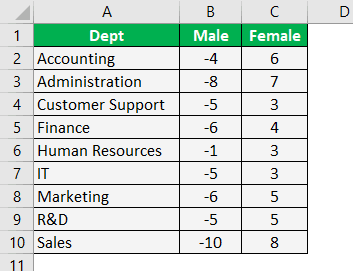
We have converted male employee numbers. So, now, we can see male employees to the left and female employees to the right.
Example #3
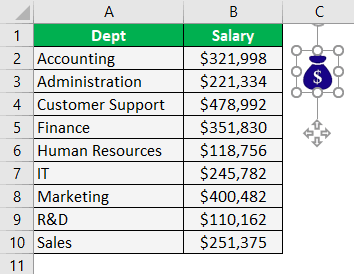
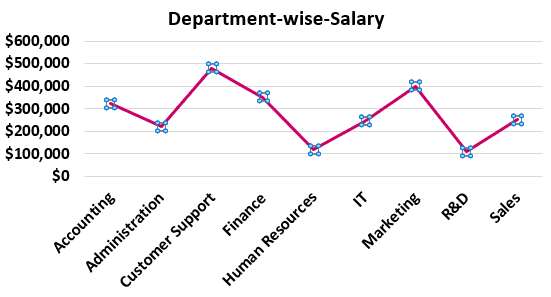
We will build one more infographic before we wind up this article. Look at the below data of department-wise salary numbers.
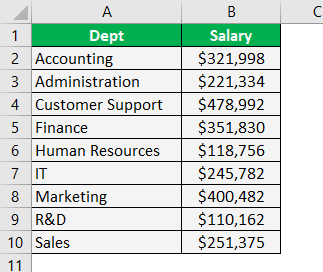
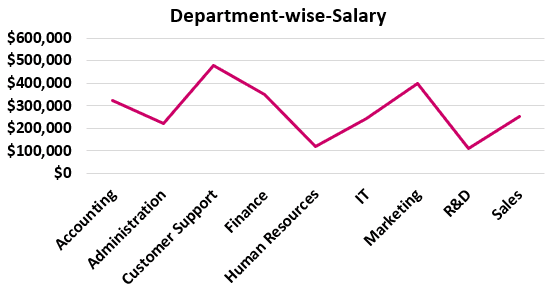
For this data, we will build the below kind of infographic chart.
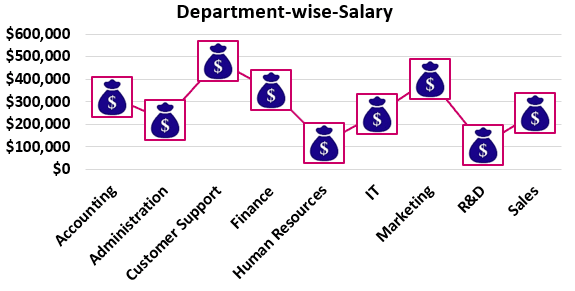
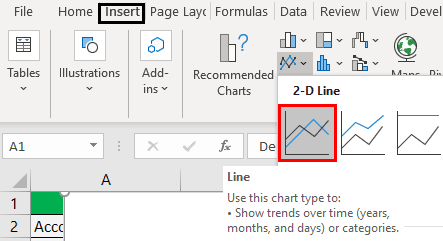
Select the data and insert the Line chart in excel.
Now we have a chart like this.
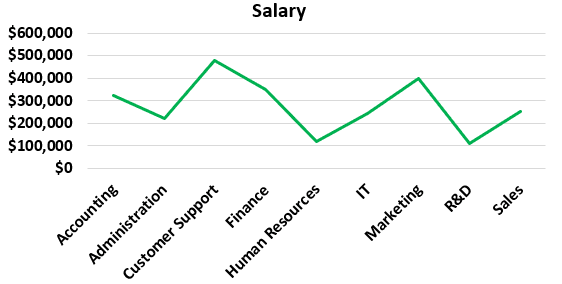
Next, we must change the line color and font colors.
Copy the below visual from the internet to Excel.
Select the line marker now.
After selecting the markers, paste the copied image.
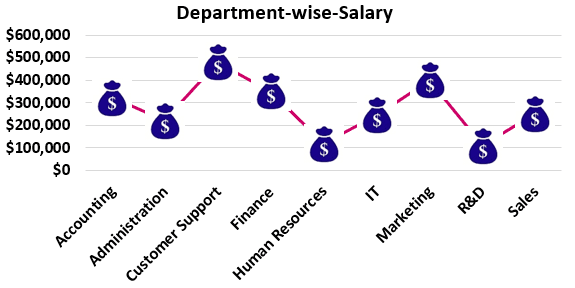
We can add extra elements to the chart as per the requirement.
Recommended Articles
Continue with these closely related articles from the same guide.