Group By Function in Power BI
Power BI GROUPBY DAX function will group data by collecting the information from two different tables. It works almost similar to the summarized function in Power BI. But, GROUPBY does not allow us to do any implicit calculations using the CALCULATE function. Instead, it allows us to use the new DAX function “CURRENTGROUP()” inside the aggregation functions in the additional column it adds.
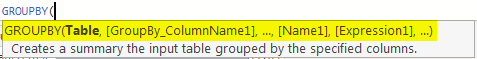
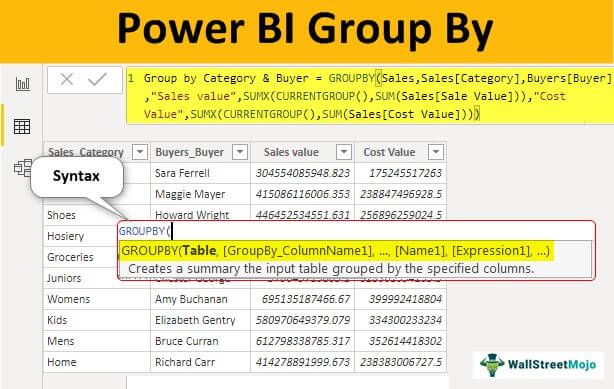
Below is the SYNTAX of the Power BI GROUPBY DAX function.
Key Takeaways
- <Table>: First, we need to specify the table name from where we are grouping the data.
- [<GroupBy_columnName1>]: What is the relationship first column from any of the two tables?
- [<GroupBy_columnName2>]: What is the relationship second column from any of the two tables?
- <Name>: This will be what is the name for the new column we are going to create.
- <Expression>: By using which DAX function, we need to aggregate the values.
We know it is not easy to understand by reading the syntax explanations, but you will learn clearly in the example sections.
How to Use GroupBy Dax Function in Power BI?
We need at least two tables to use the Power BI GROUPBY function. Below are the two tables we will use for this DAX function demonstration.
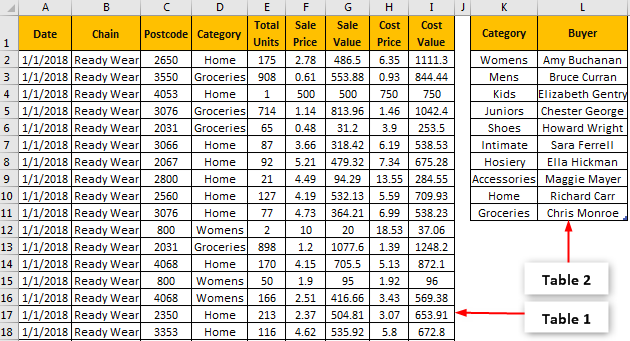
For example, in the “Buyers” table, we have the category for each buyer, so we will group the data using these two tables.
While grouping the data, we need to identify the columns we need in the new group table. In this case, we need “Category,” “Buyer,” “Sale Value,” and “Cost Value.”
Copy and paste the data directly to Power BI, or you can copy the data to an Excel file and then import it to Power BI as an Excel file reference. So, you can download the Excel workbook template from the link below, which is used for this example.
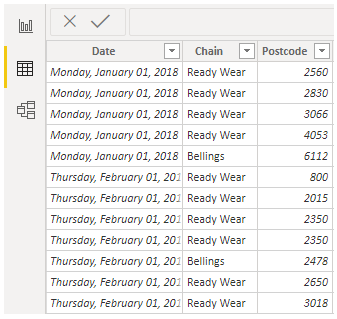
We have directly uploaded the data to Power BI.
Since we are grouping the data, we need to store it as a new table.
Follow the steps to use the GROUPBY DAX function in Power BI.
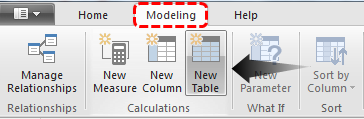
- In Power BI, go to “Modeling” and click “New Table.”

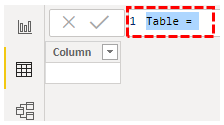
- This will create a new table. In the “Formula Bar,” we can see it has highlighted the same.

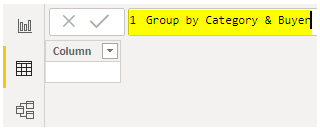
- Name this new table “Group by Category & Buyer.”

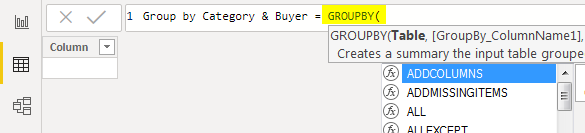
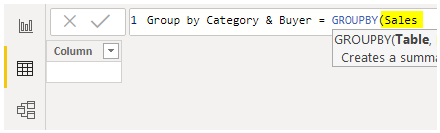
- After the table name, put an equal sign and open the Power BI GROUPBY DAX function.

- The first argument of the Power BI GROUPBY DAX function is “Table,” i.e., out of available two tables from which table we need to group the data. In this example, we need to group the data from the “Sales” table, so supply the table name as “Sales.”

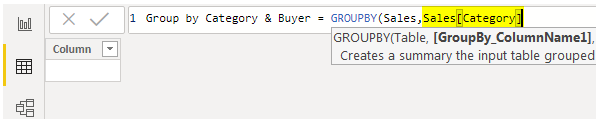
- The next argument is “GroupBy_ColumnName1,” i.e., based on which column we need to group the data. So from the “Sales Table,” we need to group by “Category-wise.” So, select the “Category” column from the “Sales Table.”

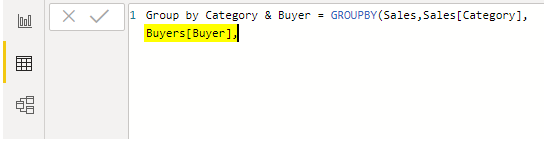
- Next, from the “Buyers” table, we need to mention the column name to be grouped. So, from the “Buyers” table, we need to group by “Buyers-wise.”

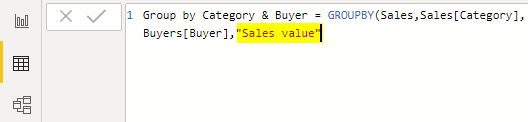
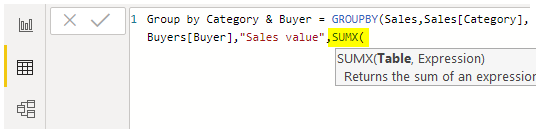
- Specifying column names is over. Next, we need to give a name to the aggregate column. Since we are aggregating the “Sale Value” column, we will give the same name only.

- Next, for this new “Sales Value” column, we need to apply the DAX function to return the aggregate value. Open SUMX function in the Expression 1 argument.

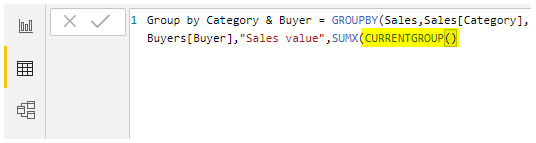
- We need to supply a special CURRENTGROUP() function for this expression.
Note:We can only use the CURRENTGROUP() function inside the Power BI GROUPBY function. This function provides access to the sub-table representing the current group in the GROUPBY function.

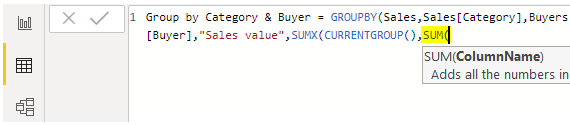
- In the next argument of the SUMX function, open the SUM function.

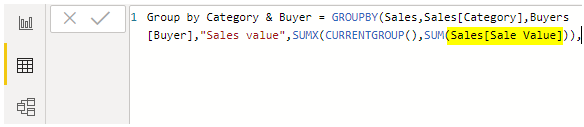
- Enter the column name after adding the “Sales Value” column from the “Sales” table. After this, close two brackets for SUMX and SUM functions and enter a comma.

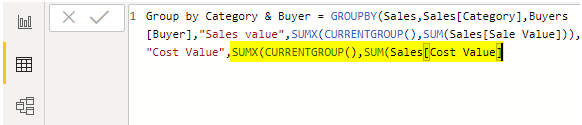
- Name 2 is the argument of the GROUPBY function, i.e., the name of the second aggregate column is. Enter the name as “Cost Value” in double quotes.

- For this, also open the SUMX function. Inside this, open the CURRENTGROUP function. Then, open the SUM function for Expression and choose the “Cost Value” column from the “Sales” table.

- Close three brackets for Power BI SUMX, SUM, and GROUPBY functions. Press the “Enter” key to close the DAX formula. Then, you can see three tables here. Select the newly created table for grouping. In this, we can see the DAX expression in the formula section.


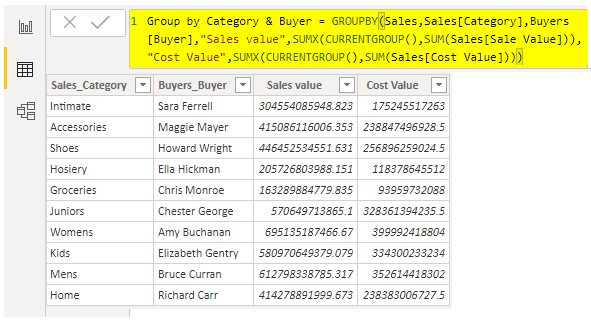
As you can see above, we can see the aggregated grouped table.
Note: We have done so much formatting to this table. You can download the Power BI RANKX template from the link below and apply each formatting technique as applied.
Things to Remember
- The CURRENTGROUP function is only the new function we can use inside the GROUPBY function.
- The CURRENTGROUP function takes the reference of the grouping table.
- We cannot use the CALCULATE function in the Power BI GROUPBY DAX function.
Recommended Articles
This article has been a guide to Power BI GROUPBY. Here, we discuss how to group the data by collecting the information from two different tables using Power BI GROUPBY DAX function. You can learn more from the following articles: –