Drill Through in Power BI
Drillthrough in Power BI is like an indicator used to focus on a specific type of data or a specific type of value generated or displayed in a report. Therefore, it is very helpful when a business user has to focus on only certain elements rather than the whole portion of data.
In Power BI, drillthrough is an option to navigate to different layers of the data of a selected category data set. For example, under “Manger,” there could be different employees. Overall, we have seen manager-wise sales performance, which comprises all his team members’ data. If you want to see “Manager 1” breakup of different employees, then drill down can help us to drillthrough this information and analyze it deeply.
Everybody wants the summary out of the big data. Very few people want to see the breakup of the data. Those who want to see the breakup of the summary report are the ones who want to study the data in detail and see what is happening with each line item of that particular category of data.
Especially in Power BI, the user does not have the luxury of seeing the breakup of the summary visual. Everybody new to Power BI dashboards is common thinking everybody has. However, we can see the detailed data or analysis using the “Drillthrough” option in Power BI.
How to Use Drillthrough Filter in Power BI?
You need some data to apply the drillthrough filter in Power BI first. Below is the data you can use to practice drillthrough.
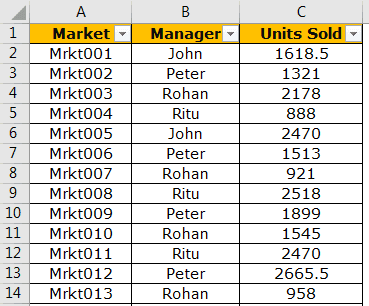
You can also download the Excel workbook from the link below, which is used for this example.
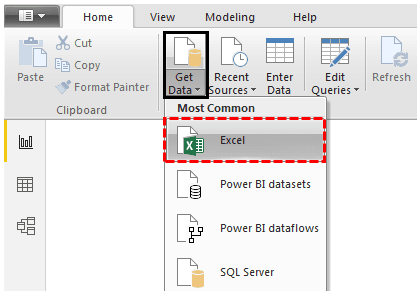
- Now, open Power BI software and upload the data under “Get Data.”
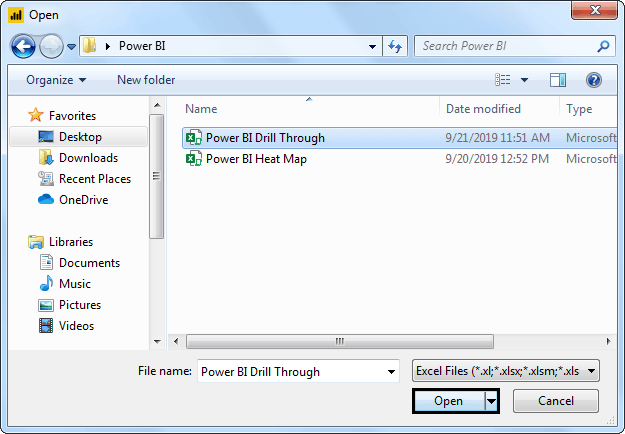
- Choose the Excel file from the saved location.
- Your preview of the upload should look like this.
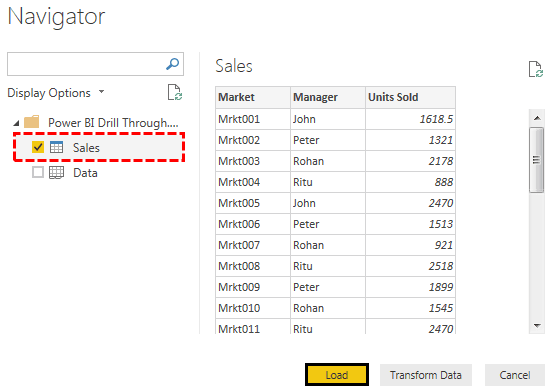
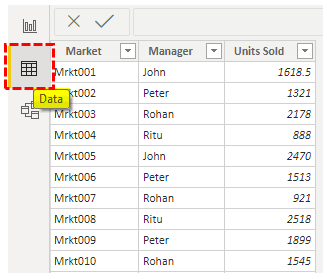
- Click on “Load,” and it will come and sit under the “Data” section.
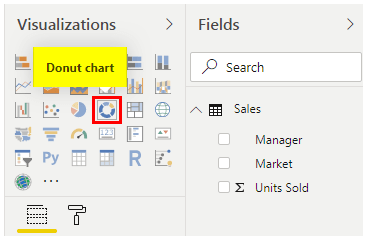
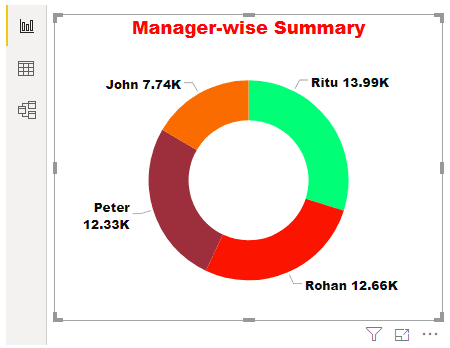
- Return to the “Report” section and insert the “Donut” chart for each manager-wise summary from the “Visualizations” tools.
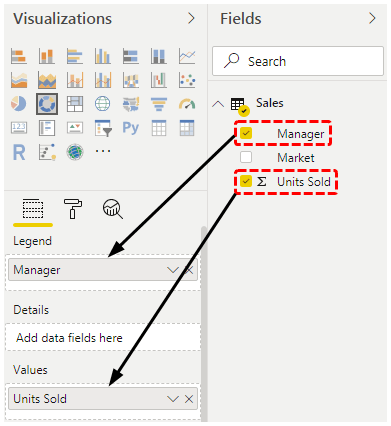
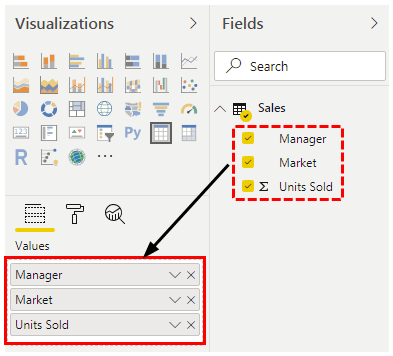
- Drag the “Manager” data to the “Legend” field and “Units Sold” to the “Values” field.
- Now, our Donut chart looks like as shown below.
- Now, create one more page as “Market-wise Sales.”
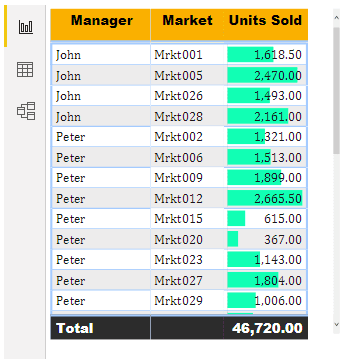
- To create a “Market-wise Sales” summary, drag the manager, market, and unit sold to values filed on this page.
- Your “Market-wise Sales” summary table is ready.
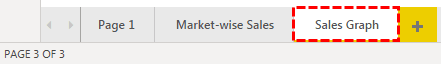
- Create one more new page and name it “Sales Graph.”
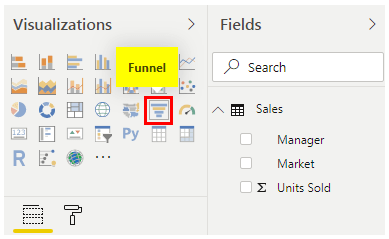
- In this sheet, create a “Market-wise” funnel chart.
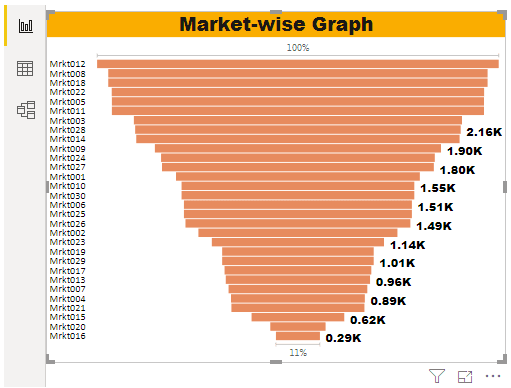
- The funnel chart market-wise is shown below.
We need to add the “Drillthrough” field on each page. Since we need to have a breakup of each “Manager-wise” from the first page, we will add “Manager” to the drill through a field.
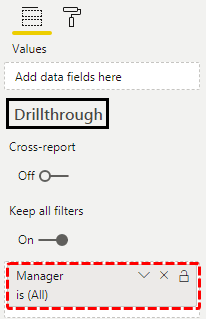
- Now, come back to the second page, “Market-wise Sales.” In this sheet from the “Fields” list, right-click on the “Manager” column and choose “Add to drillthrough.”
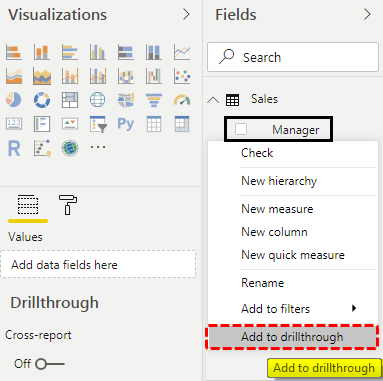
- We can see this in the “Drillthrough” filter pane.
- One more thing you need to look at is as soon as you add a field to drillthrough. We can see the automatic back button appears on the top left-hand side of the page.
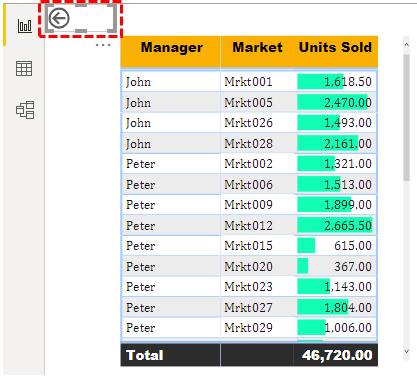
We will come back to this in a moment.
- Now, come to the “Sales Graph” page and do the same thing of adding a “Manager” column from the field to “Drillthrough.”
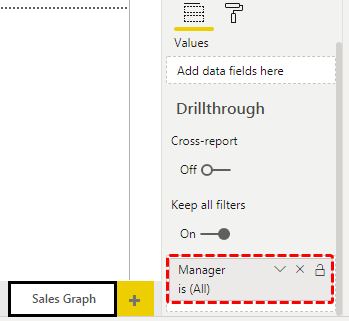
So on this page also, you could see the same column in the “Drillthrough filter” pane.
We are all set to execute the “drillthrough” option. At this point, you have no idea how this drillthrough will thrill through your mind and heart. Let us learn about it now.
- After setting the drillthrough, the field now comes back to “Page 1,” where we have created a “Manager-wise” sales summary of the “Donut Chart.”
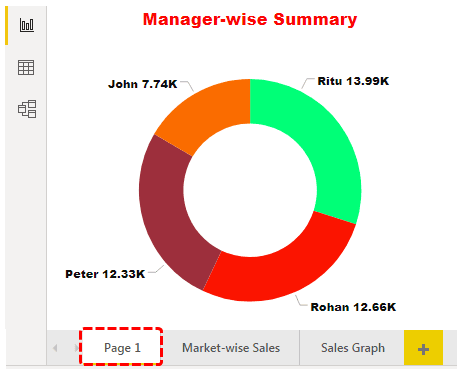
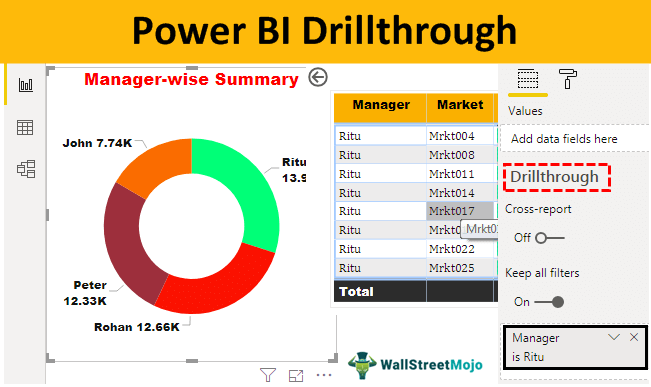
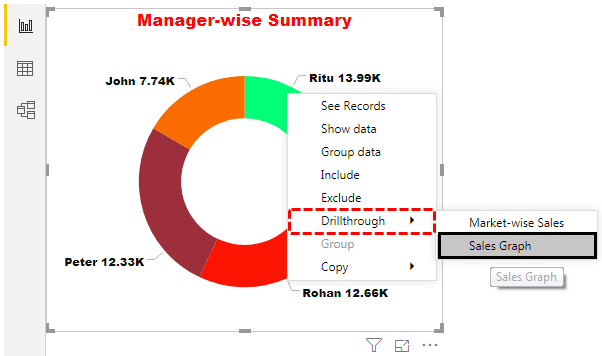
This page shows the overall sales performance of each manager from different markets. For example, manager “Ritu” has achieved a sales amount of 13.99K, which comes from different markets now. As a reader of the report, you would like to know in which market she has more revenue, which is not available with this visual.
So, how do you see that information?
- It is where all our above efforts pay off. Now, right-click on the “Ritu” portion of the donut chart.
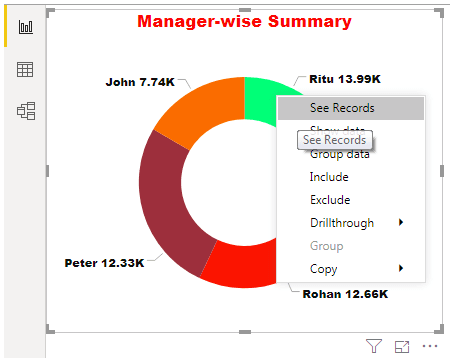
- As you can see above, we have an option of “Drillthrough.” Place a cursor on that to see inside options.
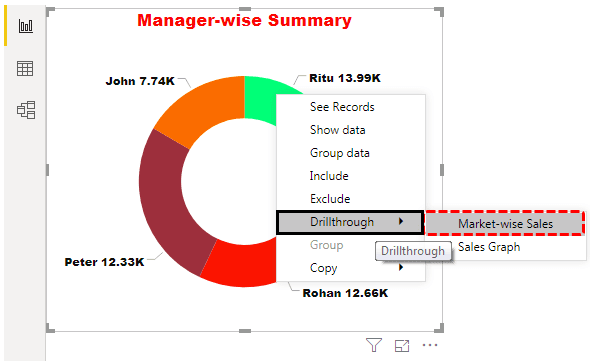
- In this, we could see our page names where we have added the “Manager” column as the “Drillthrough” option. Click “Market-wise Sales” to drill through that page to see the breakup of “Ritu” revenue from different markets.
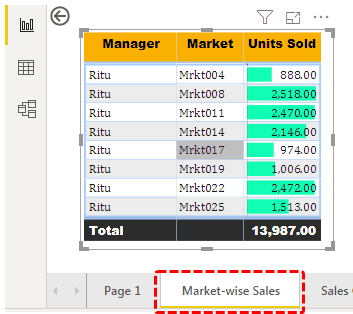
It has automatically jumped to the “Market-wise Sales” page. On this page, we could see only “Ritu’s” breakup data of revenue from different markets.
How cool is this?
- Now, if you want to go back to the main page from where we have come from, click on the “Back” button at the top left of the page by holding the Ctrl key.
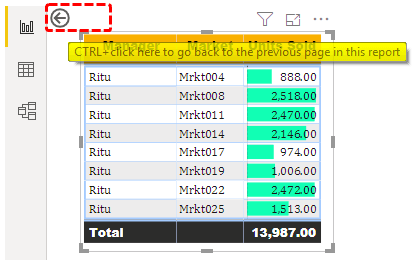
It will take you back to the original page from where you drillthrough.
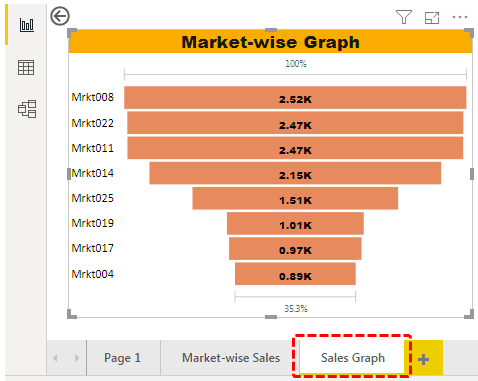
- Similarly, if you want to see “Sale Graph” of “Ritu,” then right-click and choose “Sales Graph” from the “Drillthrough” options.
- Now, it will take us to the “Sales Graph” page with only “Ritu’s” data filtered.
It is the overview of the “Drillthrough” filter option in Power BI.
Things to Remember Here
- The drillthrough options in Power BI work based on the page settings you do on each respective page.
- In Power BI, drillthrough can provide the breakup for the consolidated report.
- By using the “Back” button, we can navigate back to the original page.
Recommended Articles
This article is a guide on Power BI Drillthrough. Here, we discuss applying the drillthrough filter in Power BI to navigate different layers of data, along with examples. You may learn more about Power BI from the following articles: –