Table Of Contents
Switch Function in Power BI
We all know how important logical functions are in data analysis and interpretation. At the same time, talking about logical functions, “IF” is the father of all the logical functions we use. But, few of us know there is an alternative to the IF condition in Power BI. Finally, we have an alternative to the IF condition, the SWITCH DAX function in Power BI. This article will guide you in detail through the DAX function SWITCH.
What Does SWITCH Function Do in Power BI?
SWITCH is a kind of logical function to arrive at results based on multiple conditions. So, the Power BI in the switch function looks at all the logical conditions and arrives at the result of the logical condition: TRUE. However, unlike IF conditions, we cannot use complex calculations with SWITCH, but a good enough function to replace nested IF conditions in excel.
Below is the syntax of the SWITCH function in Power BI.

The syntax is unlike the IF function, but we will explain it below.
- Expression: This is nothing but the column that we need to evaluate.
- Value1: For this, we can apply what is the logical test we need to do against the Expression column.
- Result1: If the Value1 logical test is TRUE, what should be the result?
- : This is the optional parameter. If the Value1 logical tests are FALSE, then what is the second logical test to evaluate the Expression.
- : If the Value2 logical test is TRUE, what should be the result?
- : If all the logical tests are FALSE, then what is the alternative result needed.

Examples of SWITCH Function in Power BI
Below are examples of the switch function in Power BI. You can download the workbook using the same file we used in this example.
Example #1
Below is the data table we will use to demonstrate the SWITCH function in Power BI. You can download the Excel workbook and use the same to practice.

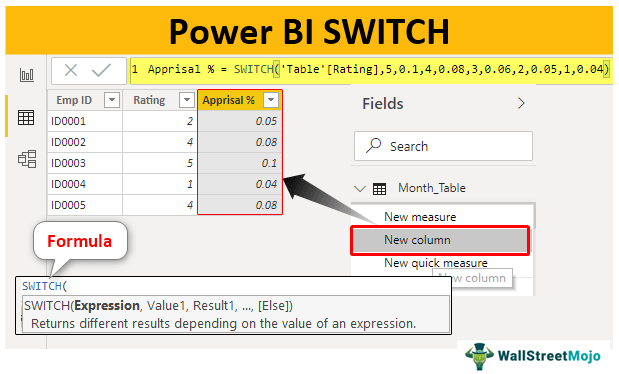
We must arrive at "Appraisal %" based on the available rating value. Below are the criteria to arrive at the "Appraisal%."
- If the rating is =5, the appraisal percentage will be 10%.
- If the rating is =4, the appraisal percentage will be 8%.
- If the rating is =3 then the appraisal percentage will be 6%.
- If the rating is =2, the appraisal percentage will be 5%.
- If the rating is =1, the appraisal percentage will be 4%.
Upload the data table to Power BI to start the proceedings.

Right-click on the table and choose "New column" to arrive at "Appraisal %" in the new column.

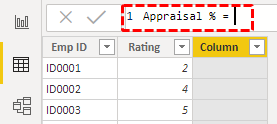
Now, name the new column "Appraisal %."

Open the SWITCH function in Power BI now.

The first argument is Expression, which column we need to test to arrive at "Appraisal %" in the new column. So, in this case, we need to arrive at the result by testing the rating, so choose the "Rating" column.

Value 1 is nothing but the logical test that we need to apply against the Expression column, so our first logical test is to check whether the rating is =5 or not.

The next argument is Result1,i.e., what is the result if the Value1 logical test is correct. So, we need the result as 0.10.

Next is Value2, i.e., if the Value1 logical test is "False," then what is the second logical test that we need to apply, so we need to test rating =4 or not.

If this logical test is "TRUE," Result 2 will be 0.08.

Similarly, the next applies the third logical test.

Close the bracket and press the "Enter" key to get the result.

We can arrive at results, but we need to include different strategies regarding logical operator usage.
Example #2
Now, look at the below data.

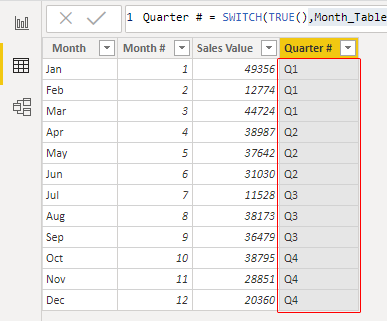
We need to arrive at a new column from this table as "Quarter." To arrive at this column, we need to test month numbers, and below are the criteria.
- If the month number is >9, the quarter is "Q4".
- If the month number is >6, the quarter is "Q3".
- If the month number is >3, the quarter is "Q2".
- If any other month number, then the quarter is "Q1".
So, we need to test three conditions. If all the three are "FALSE," the quarter will be "Q1". Upload the data table to Power BI to start the proceedings.

Right-click the table and choose "New column" to arrive at quarters in the new column.

Now, name the new column "Quarter #."

Choose the SWITCH function.

The first argument is Expression,i.e., we must first supply the logical value TRUE.

Then, we can use logical tests like the below by selecting the column.

By using the above technique, we can use logical operator symbols.

Note: We can also download the Power BI dashboard file from the link below and view the final output.
Things to Remember
- parameter is used only to get the alternative result.
- We cannot use logical operator symbols like the IF condition but need to use the TRUE or FALSE logical function to use logical operators.

