Power BI Features
Apart from awesome visualization and data representation, there are various other features of Power BI, such as content packs. These packs have samples of dashboard reports. In addition, natural language means a user can adjust language, custom visualization, and DAX functions.
Power BI was launched in 2013, keeping the modern data-driven world in mind to make decision-making reports and get insights from the data sets. It is a product of Microsoft, and they entered the market with the below slogan.
In this article, we will take a tour of the top 8 features of Power BI:
- Data Connection
- Data Relationships
- Power Query, Power Pivot Access
- Cost of Power BI
- Custom Visualizations
- Power BI Question and Answers
- Report Sharing
- Mobile App
Features of Microsoft Power BI
#1 – Data Connection
As Excel users, we usually get the data in an “Excel Workbook” or a Text file or CSV file. But, this is not the case with Power BI because it can get data almost everywhere.
Microsoft has developed data source connections with a huge list of sources like SQL, Azure, Excel, Text, CSV, PDF, Cloud, and on-premises data. It does not matter where the data is and what format it is; we will get a detailed view of it.

#2 – Data Relationships
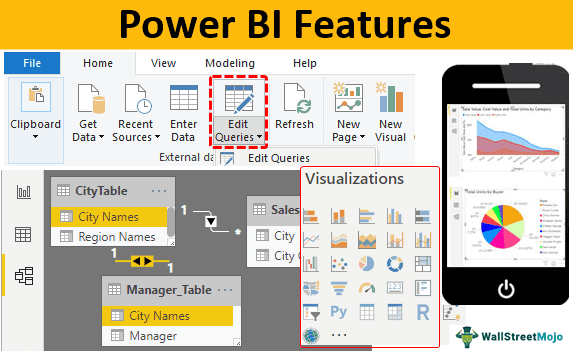
In Power BI, if you have data in multiple columns, then we can define the relationship between those tables based on at least one matching column from either table. Below is the screenshot of creating relationships between tables.
We call this process “Data Modelling” in Power BI.

#3 – Power Query, Power Pivot Access
We can edit the data in Power BI using “Power Query in Excel” and “Power Pivot.” These are all different components of Power BI, which helps the user alter the data to fit their needs. Power BI Query is used for data transformation and manipulation tools, and Power Pivot is a memory tool to model the data.

#4 – Cost of Power BI
We would consider Power BI cost a key feature because when you compare Power BI with other data visualization tools like Tableau, QlikView, and other products cost much less than that.
And one more thing about Power BI is its free version of Power BI Desktop comes free of cost with enough features for the starter to get started with data visualization.
#5 – Custom Visualizations
Power BI has many built-in visuals to build dashboards and reports. Apart from these built-in visuals, users can download the custom visuals from marketplaces per their requirements.

#6 – Power BI Question and Answers
Power BI can answer your queries regarding the uploaded data. For example, after the data is uploaded to Power BI, it would help you with the information required, like “What are the total sales for the year 2018?” you have to type the question. Then, it would show the result with a beautiful visual or chart.
#7 – Report Sharing
When you share a report in Excel, you share it with the data sets, but in Power BI, using Power BI Pro services, we can share the report with team members without worrying about data security.

#8 – Mobile App
The Power BI app is available to download. It makes the report reaching the end-users much easier and simpler. Once the report is shared with the end-user, they must sit in front of the laptop or system. Rather, they can open the Power BI app on their mobile and start reading the report instantly.

Other Features
- A quick share of reports to colleagues or others through Power BI services.
- Real-time analytics.
- Representation of the data through rich visuals and graphics.
- Have control over end-users’ activities.
- Simple drag and drop method to create visualizations and dashboards
- An easy way of data import and export options
- Auto-refresh of data in case of a cloud-based data source.
- Interactive dashboard with slicers and filters.
- Easy installation procedures.
- DAX functions to create calculated measures.
- Using Power BI Publish to the web, we can publish the story on our organization’s websites with stunning visualizations.
Recommended Articles
This article is a guide to the Features of Power BI. Here, we discuss Microsoft Power BI features, including data connection, relationships, pivot access, cost of Power BI, custom visualizations, Power BI question and answers, report sharing, and mobile app. You can learn more about Power BI from the following articles: –