What are Bookmarks in Power BI?
Bookmarks have been commonly used in most applications, such as any browser that goes to the previously configured or saved page. Like Power BI, we use bookmarks to go to the previous configuration of any data page or report page. It will be in the same way, including the filters and visuals.
Bookmark is generally used with the web URL link to return to the bookmarked link immediately. A similar concept of the bookmark is integrated with Power BI as well. However, not to go to any URL link but to capture the current view of the visualization. Once you click on the created bookmarked icon, you can go back to the captured screen or visualization.
Do not think that bookmark is a screenshot feature. But, it is an advanced interactive tool available in Power BI to play with the data insights.
This kind of interactivity with the data is possible combined with “Bookmarks,” “Selection Pane,” and “Buttons.”
How to Create Bookmarks in Power BI?
Now, we will show you simply what a bookmark is. For example, we have the below column chart for city-wise sales values.
Note: Import Data from Excel to Power BI and create a chart.

Copy and paste the data directly to Power BI. Else, you can copy it to an Excel file and then import it to Power BI as an Excel file reference. So, you can download the Excel workbook template from the link below.
As a reader, we do not want to see this chart. Instead, we want to view a line chart, and someone wants to view a horizontal bar chart. Here, we have three requirements. Instead of showing all three charts, we will create a bookmark for each, assigning a bookmark to toggle between charts per the users’ selections.
Follow the below steps to create bookmarks in Power BI.
Copy and paste the already created column chart on top of the same chart and change the chart type to “Clustered bar chart.”

Copy one more, paste the existing chart, and change the chart type to “Line chart.”

Now, we have three charts on top of each together.Go to the “View” tab and check the box “Selection Pane” to view “Selection Pane” to the right.

Now, from the “Selection Pane,” we can hide and unhide the charts we have created. Click on the “eye” icon in the “Selection Pane” to hide or unhide. We have hidden two “eye” icons. In the “Report” view, we can see only one chart, “Column Chart.”

We have downloaded the following three types of chart visuals from the internet. And we need to insert these images into Power BI.

Go to the “HOME” tab, and click on “Image.” It will ask you to choose the image from the saved location, so choose your folder. It will insert one image simultaneously, so repeat the above step and insert all three images.

Go to the “View” tab and check the “Bookmarks Pane” box.

You can see the “Bookmarks Pane” on the right, just like the “Selection Pane.”

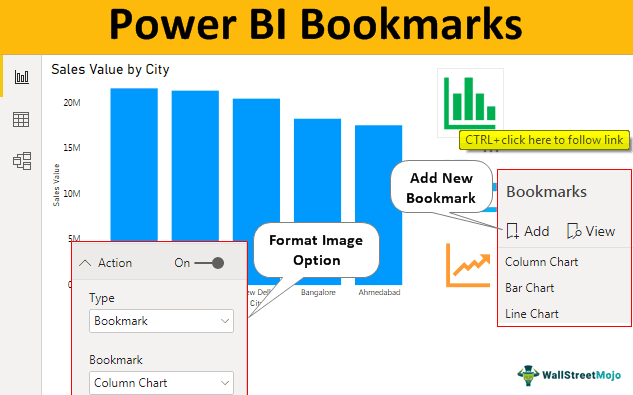
From “Bookmarks Pane,” click on “Add.” It will insert the bookmark as “Bookmark1.” Double click on this and change the name to “Column Chart.”

Now, select the “Column Chart.” It will open up the “Format Image” option to the right side. Under the “Format Image” option, turn on the “Action” option, and click on the down arrow to see further options under this. From the “Type” dropdown list, choose “Bookmark” it will open up one more “Bookmark” option from which we must choose the already named bookmark.


Like this, repeat the same for “Bar Chart” and “Line Chart.” Now, all our Power BI bookmarks are completed.
We now see “Line Chart” to see “Column Chart.” Hold the Ctrl key and click on the “Column Chart” image. It will take you to the “Column Chart” view.

Like this, we can create bookmarks to capture the moments and toggle back to those steps with just a click of the button.
Note: We can also download the Power BI dashboard file from the link below. We can view the final output.
Things to Remember
- Bookmarks work with the other options: “Selection Pane” and “Button.”
- Once we bookmark, the screen may take us back to the original page even though that view no longer exists.
- We must insert buttons or images from outside folders to assign the bookmarks.
Recommended Articles
This article has been a guide to Power BI Bookmarks. Here, we discuss creating bookmarks in Power BI to return to the captured screen or visualization with an example. You can learn more from the following articles: –