What is Drill Down in Power BI?
Drill down is nothing but the next level of hierarchical insights into the data. So, for example, when you show a year-wise sales summary, you may want to dig deep into the “Monthly” summary, “Quarterly” summary, and day-wise summary. So, this is where the drill-down feature of Power BI plays a crucial role in showing detailed drill-down insights.
Going from the general view of the data to a detailed view with a click of the mouse. Drilling down is an important power BI feature because, in a yearly revenue chart, you may see overall sales as “2M.” Still, there are chances that most of the revenue is generated in a single quarter or few months, so drilling down the general view of the summary deeper will give the correct picture.

How to Use Drill Down Option in Power BI?
You can download the workbook to use the same file as we used in this example.
Follow the steps to use the drill down option in Power BI.
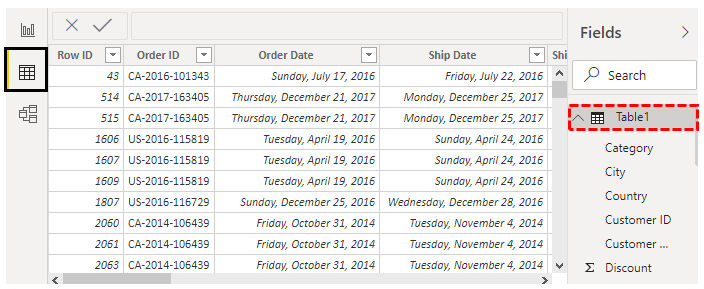
- To demonstrate this, we will use the data below that you can download as an Excel workbook to practice with us.

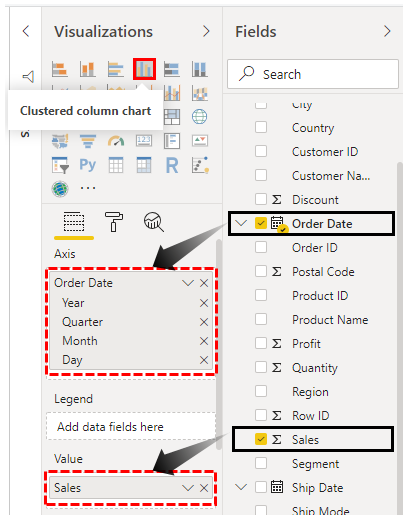
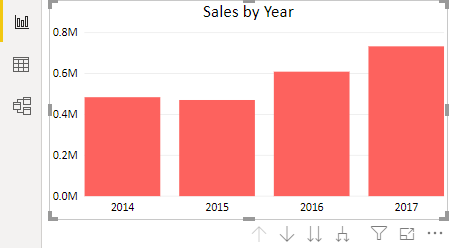
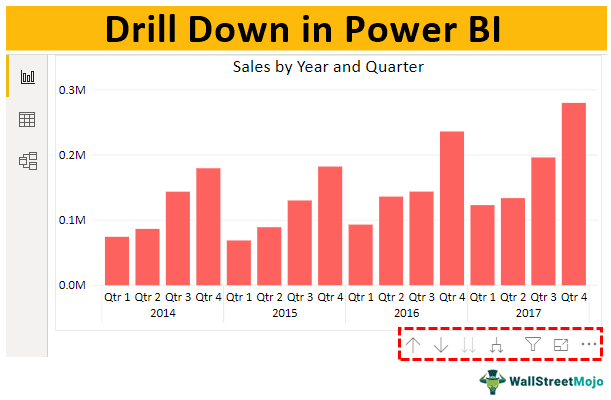
- Now, create a clustered column chart to view the yearly sales summary for this drag and drop the “Order Date” column to “Axis” and the “Sales” column to “Value.”

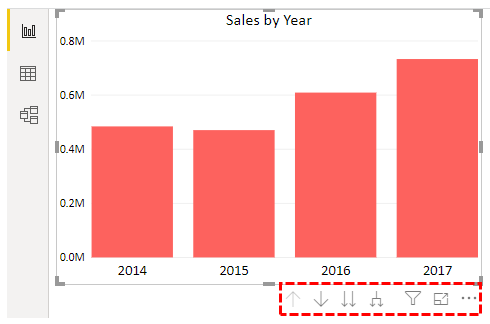
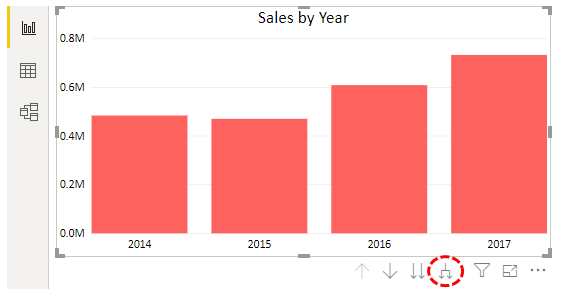
- It has created a yearly column chart.

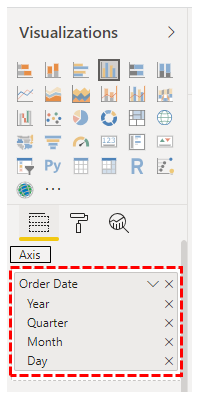
- Under “Axis,” when we drag and drop the “Order Date” column, we can see it has created a hierarchy of dates in terms of “Year,” “Quarter,” “Month,” and “Day.”

- We can use “Drill Down” and “Drill Up” options whenever there is a hierarchy. Looking closely at the bottom of the chart, we can see some arrow keys.
The first is “Up Arrow,” the second is “Down Arrow,” the third is “Double Down Arrow,” and another one is of “Expand” options.

- As of now, “Up Arrow” is not active because, in the hierarchy of order and date, the first option is “Year,” and also, the chart is showing the “Year” summary only, so we cannot go any further up.

- The next option below the “Year” is “Quarter,” so now, if you click on “Double Down Arrow,” it will show the chart quarterly-wise.

- As you can see above, we once clicked on the “Double Down Arrow.” It has taken us deeper into the next level, i.e., the “Quarterly-wise” chart, and “Up Arrow” is active now. Since we have moved one level down or one hierarchy down, we can go up.

- Similarly, clicking on this “Double Down Arrow” will move one more level further and show a monthly summary.

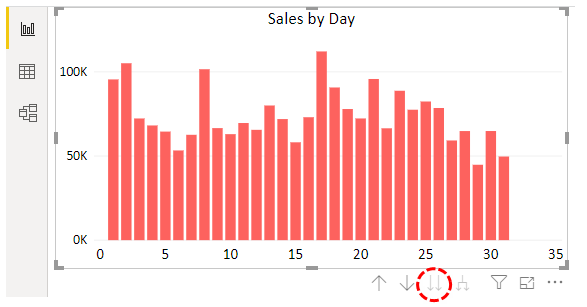
- Now, it is showing a monthly summary. Similarly, clicking “Double Down Arrow” one more time will take you to the last hierarchy level, “Days.”

- After reaching the last hierarchy level, we no longer drill down.

- So now, if we press the “Drill Up” option, it will take us above levels from the current level, as shown below.
Days >> Months >> Quarters >> Years.
- When we are at the first hierarchy level, “Years,” we can see the “Expand” option is enabled.

- It will expand everything at once. Click on this option to see its impact.

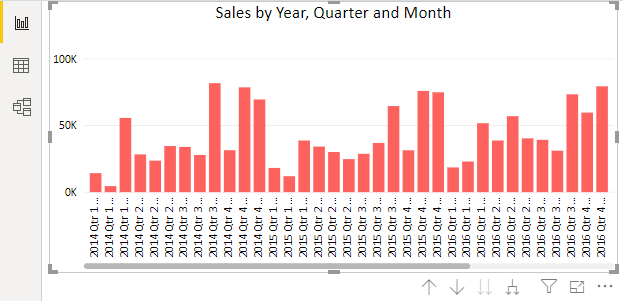
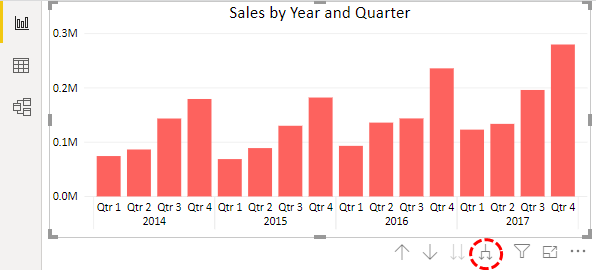
- By clicking on this option once it has taken us one hierarchy down, “Year” and “Quarter.” Now, click to see yearly, quarterly, and monthly.

- The “X axis” values do not look neat. It is more to do with settings of the “X axis,” first come back to the 1st hierarchy level, “Year.”

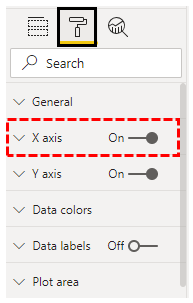
- Now, click on the “Format” option. Next, click on the “X axis” dropdown list.

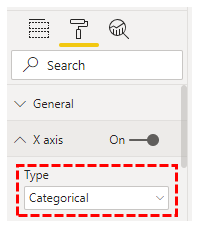
- From “Type,” choose “Categorical” as the option.

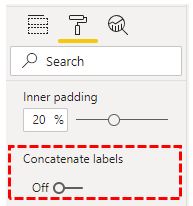
- The moment you choose “Categorical” as the “Type” option at the bottom of the same “X axis” option. It will enable the “Concatenate labels” option. Turn “Off” this feature.

- After this, click on the “Expand” option to see the neat alignment of the “X axis.”


We can see “Year” only once for all the four quarters.
Drill Down Feature For Non Date Columns
We can apply this drill-down feature not only for columns but also for non-date columns.
- For example, we need to see “Category-wise” and “Sub-category-wise” drill down a summary for this first insert “Category-wise” chart.
- Now, look at the chart.

- Now, drag and drop the “Sub-Category” column to just below the “Category” column under the “Axis” of the chart.

- Now, look at the chart.

As soon as we insert another field chart that has enabled the drill-down option using the drill-down, we can see both the “Category-wise” and “Sub-category wise” summary chart.
Note: We can also download the Power BI drill down file from the link below. We can view the final output.
Things to Remember
- The drill down feature requires a hierarchy of the columns to be used with visuals.
- The date hierarchy is automatically created.
- Not all the visuals support drill down and drill up features.
Recommended Articles
This article has been a guide to Power BI drill down. Here, we discuss using the drill down feature in Power BI to summarize the data in the next hierarchical level, along with examples. You may learn more about Power BI from the following articles: –