What are Slicers in Power BI?
Slicers in Power BI are very similar to what we use in MS Excel. For example, we can use slicers to filter out some specific data from a report. Still, these filters are visible in the data itself. So, using these slicers, users can select any values they want to display in the report.
Slicers in Excel are visual filters that enable us to see the summary only for the selected datasets. A slicer is an alternative way of filtering the data in the Power BI dashboard. We can filter the specific data easily with just a click on the button.
How to Add Slicers Filter in Power BI?
Look at the below image of the dashboard in Power BI.
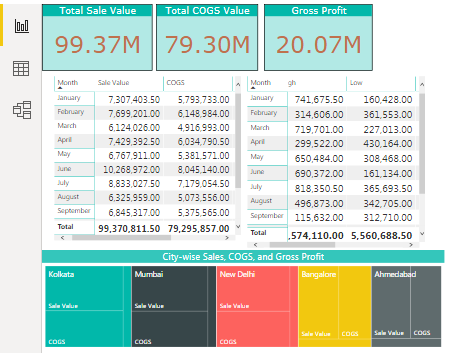
The above dashboard has many visuals with a summary of the entire data.
To create this power bi dashboard, use the following Excel data by downloading it.
Example #1
If you want to see “Sales,” “COGS,” and “Profit” value for any specific product, we have many options on this dashboard. By adding the Power BI Slicer option, we can create one.
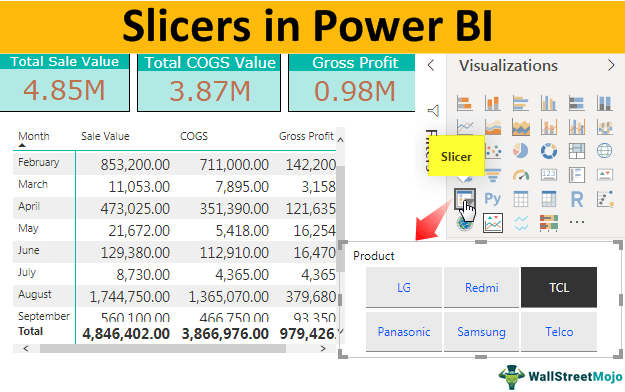
From the “Visualizations” pane, click on the “Slicer” visual on the dashboard page.

For the “Fields” pane of the slicer, visual drag and drop the “Product” column.

It should insert the product name into the slicer.

We can choose available products, and then the dashboard will show numbers only for the selected product.We will choose “LG” from the slicer and see its impact on the overall dashboard.


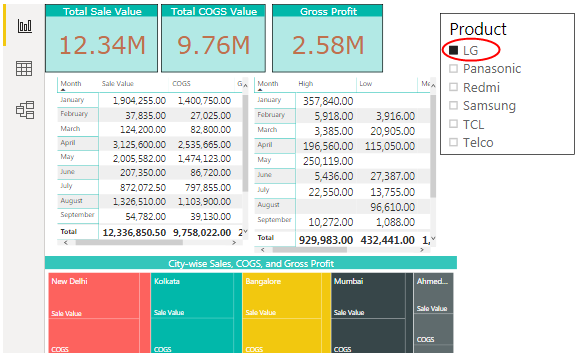
As you can see above, overall sales showed “99.37 M” since we selected only the “LG” product from the slicer. Therefore, it only shows “12.34 M,” and the other visuals show values only for the selected product (LG).
Example #2 – Add Multiple Slicers
We can add more than one slicer type to our Power BI dashboard. For example, we have added a similar slicer for “Product” and a slicer for “City.”

- Now, choose any one city and anyone product and see the magic with dashboard numbers. For example, we have selected the city as “Bangalore” and the product as “Redmi.”

- Below is the dashboard for selected items.

So, the overall total sale value for the city “Bangalore” for the product “Redmi” is “2.92 M.”
Power BI Slicers Formatting
Once we add the slicers, it is important to know how to play with the Power BI slicers. Below are some of them.
#1 – Select Multiple Items
To select multiple items from the Power BI slicer, you need to hold the Ctrl key and keep clicking on the values you want to select.

- You can also design the selection option under a slicer’s “Format” tab. Go to “Format” and click on “Selection controls.”

#2 – Insert Underline for Each Value
If you want to show an underline for each item in the slicer, we can do it from the “Item” section from the “Format” tab. Then, select the “Bottom only” option from the “Outline” to add the underline.

From this section, you can also change the font color of each item in the slicer, font size, background color, font name, etc.

#3 – Show Drop Down Instead of List
If you do not want to show a Power BI slicer in the selection list like the above and instead want to show a drop-down list, you can do this by clicking on the down arrow key of the slicer. It will show the option of “List” or “Dropdown.”

Based on the selection you make, it will start to show the slicer accordingly. For example, we have chosen “Dropdown,” and our Power BI slicer looks like this now.

#4 – Change Orientation
One more thing you can do to fit in your slicer is you can change the “Orientation” of the slicer to either “Horizontal” or “Vertical.”

Since we have chosen “Horizontal” as the “Orientation” type, our slicer will look like this.

Note: We can also download the Power BI dashboard file from the link below and view the final output.
Things to Remember
- Slicers affect all the visuals in the dashboard.
- Power BI slicers are very similar to pivot table slicers.
- We can insert as many slicers as we want to based on the data columns.
- Power BI slicers work like visual filters for visuals in the dashboard.
Recommended Articles
This article is a guide to Slicers in Power BI. Here, we discuss how to add and format a slicer to filter the data in the Power BI dashboard with the help of examples and a downloadable template. You can learn more about Power BI from the following articles: –
- How to Share Reports in Power BI?
- Power BI vs Tableau
- Power BI Tooltip
- Use Power BI Conditional Formatting
Recommended Articles
Continue with these closely related articles from the same guide.