Table Of Contents
Getting Started with Power BI Desktop
Getting started with Power BI is a tutorial on Power BI for new users who are using the service of Power BI for the first time. A Power BI is a collection of different software such as apps and connectors to provide a visual for data.
Power BI is a product of Microsoft and was launched in 2013. It is a business intelligence and data visualization tool to get the story behind the data via eye-catching visualizations. Of course, the Power BI is not only limited to use for visualizations. But we can transform, manipulate, and do other tremendous things using this. Power BI rests on the logic of Business Intelligence, which is used to make informed decisions.
Table of contents

Power BI Versions
It has 4 types, and those are.
- Power BI Desktop
- Power BI Services
- Power BI Pro License
- Power BI Premium.
Out of the above 4, "Power BI Desktop" is a free version with unbelievable features for a free version. So, to get started with the Power BI "Desktop" version is enough.
Download Power BI Desktop
Power BI Desktop is a free version. You can download this software from the link below.
https://powerbi.microsoft.com/en-us/desktop/
Once you download the Desktop version, install it on your computer. After the installation, you are good to go with Power BI Desktop.
How to Get started with Power BI Desktop?
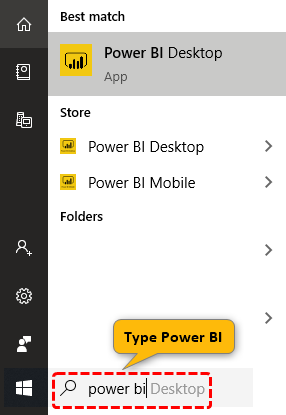
To open Power BI from your computer on the start button, Type "Power BI," all the related searches come up, and choose "Power BI Desktop."
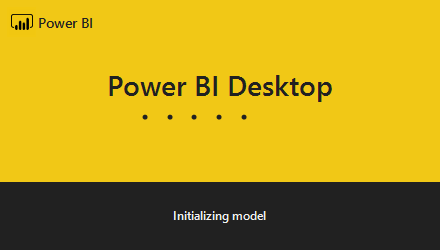
- It will take time to load the Power BI. After that, you will get a screen like the below one.
- Once the Power BI file opens up, it will ask you to introduce yourself with your name, designation, company, etc.
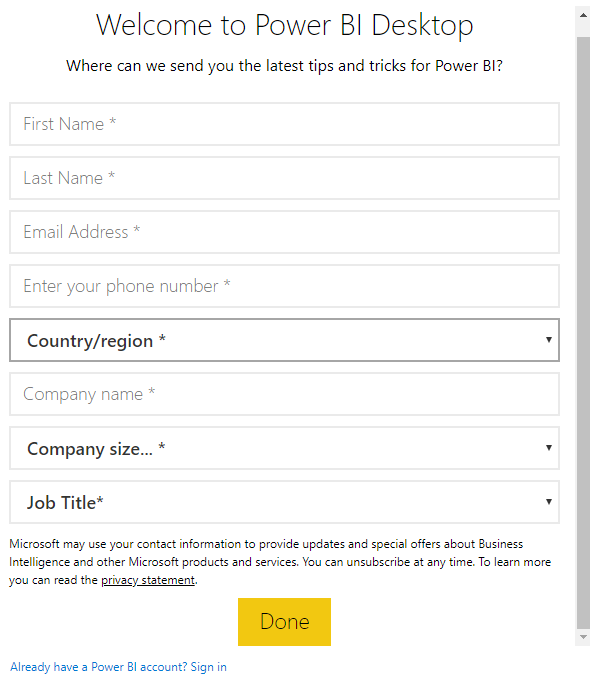
- It is not required to start things off. So, close this window, and finally, we could see the full view of Power BI.
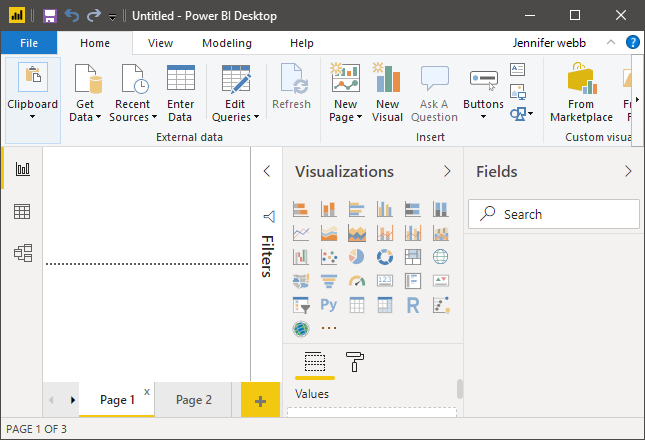
- As we told you, it will look like an advanced version of Excel. So, for example, we have a ribbon tab in excel.
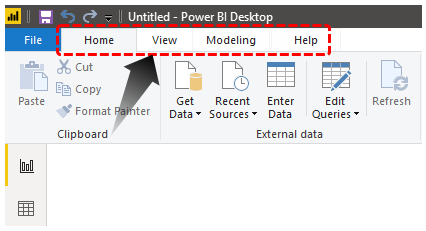
And just below this, we have three icons.
- These are very important in Power BI. The first is the "Report Tab," the second is the "Data Tab," and the third is the "Relationship Tab" on the screen.
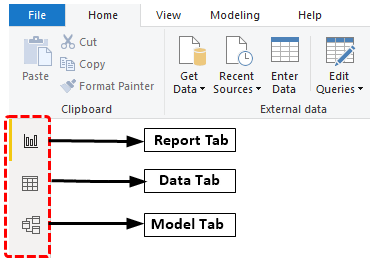
Using the "Report Tab," we can create reports and visualizations. Using the "Data" tab, we can see all the Data Tables. Finally, using the "Relationship Tab," we can define the relationship between multiple tables.
And on the right-hand side, we can see below things.
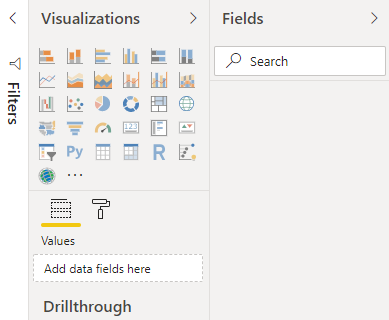
The first field is "Visualizations." This tab contains all the built-in visuals available for the Power BI, but we can also add custom visuals. But that is a different thing.
And the last thing is "Fields." It is nothing all the uploaded Data Tables named. However, if you click on the down arrow of each table, we can see the table's fields.
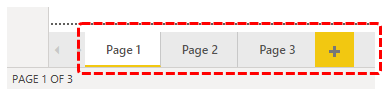
At the bottom, we could see the "Page Layout," just like how we have the "Sheet" tab in MS Excel.
Create Reports in Power BI Desktop
We need some data to create reports.
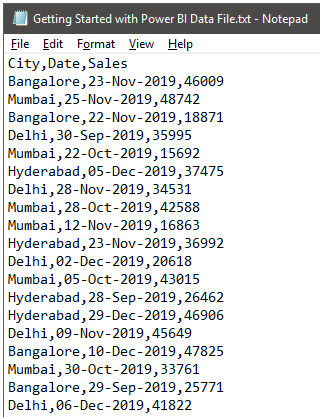
So, we can get the data from various sources like Excel, Text, CSV, Web, SQL Server, Cloud, etc. Now, we will use how to upload the data from a text file. Below is the data we are using from the text file.
In the Power BI file under the "Home tab," click on "Get Data."
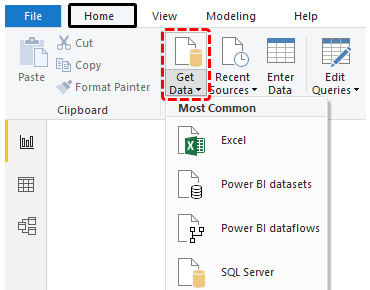
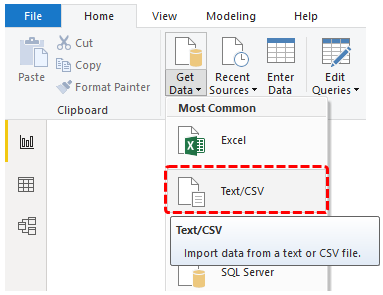
- As you can see above, we have many data source options. Since our data is in the form of a text file, choose "Text / CSV" as the file source.
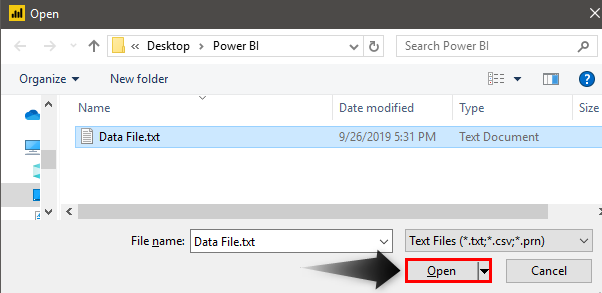
- Now, it will ask you to choose the file from the save folder location in your system. Then, finally, click on "Open" to upload the file.
- Before you upload the data, it will show you the data preview.
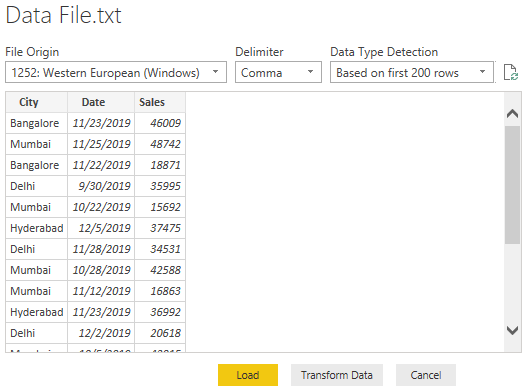
As we can see above, Power BI is smart enough to find the delimiter, i.e., column separator common thing, which is a comma () in this case.
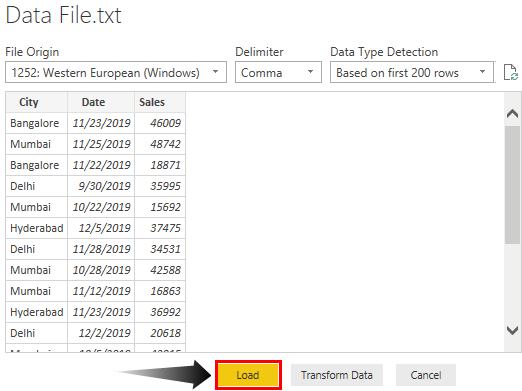
We can transform the data as we want by clicking on the "Transform Data" button. Then, since Power BI has already transformed the data, click on "Load" to upload the file.
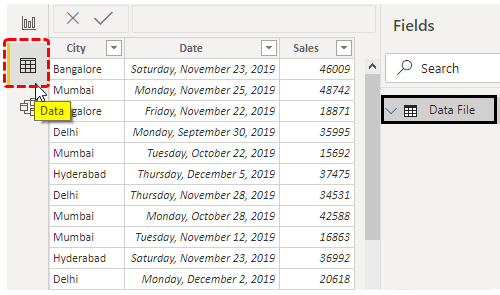
Now, under the "Data" tab, we should see this data.
Now, come back to the "Report" page to create reports.
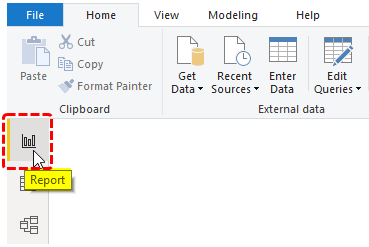
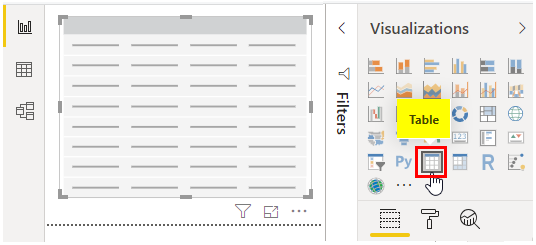
On this page, we will create all our reports. For example, if we want to create a "City-wise" summary table, we first need to insert a blank "Table" visual.
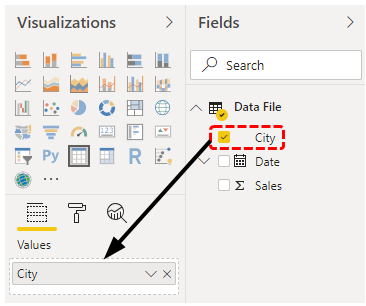
First, drag and drop the "City" column from the "Fields" of the table to the "Values" field of the Table visual.
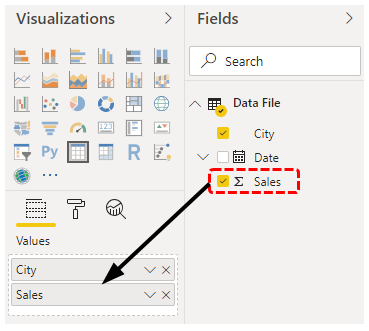
Now, drag and drop the "Sales" column just below the "City" in the "Values" field.
It will create a simple summary table for us. Below is the screenshot of the same.
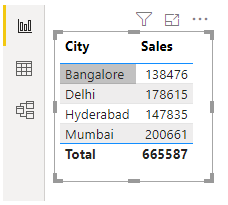
Like this, by using Power BI, we can create data or report insights quickly.
Things to Remember Here
- Power BI is like advanced Excel for those from the advanced versions of Excel.
- Power BI Desktop is a free version. It is more than enough to start Power BI learning.
- Depending on the data source, we must choose the data source option.
Recommended Articles
This article is a guide to Getting Started with Power BI. Here, we discuss how to get started with the Power BI desktop and the steps to create a report with examples. You may learn more about Power BI from the following articles: -
- LOOKUPVALUE in Power BI
- Compare Power BI Dashboard and Report
- Slicers in Power BI
- Create Waterfall Chart in Power BI
- Power BI vs Qlik Sense
