What is Tooltip in Power BI?
In Power BI, Tooltip is nothing but showing extra data labels on the visual other than the used field values to the visualization. If creating visualization is the mastering thing adding little things to the existing dashboard can make the report more valued and worth it. One such thing we can do with Power BI visuals is adding “Tooltip” to the visualization.
For example, if you have a monthly sales amount and have created a column chart for the monthly sales amount.

Now, if you, however, on any of the bars in any of the months, it will show data labels and categories, i.e., that particular month’s name and sales value.

In the above image, we have hovered on “November” month. Immediately, we can see the category name as “November” and the category data label as sale value 118,447.82.
By hovering on each bar, we can see the data value of each bar. Now the question is, what is the profit value for this month?
As of now, if you want to see the profit value, we have to insert one more new field or add a different visualization only. So, this is where our “Tooltip” will help us.
How to Add Tooltip to Show Other Values in Power BI?
You can also download the excel workbook from the below link, which is used for this example.
- We have created a clustered column chart with only one data field as the “Sales” value and an “Axis” as a “Month.”
- Our clustered column chart looks like, as shown below.
- When you select the visualization, we can see all the fields of that visualization. One thing we all have ignored all these while in the “Tooltip” field.

By adding columns to these fields, we can see the different data points without adding them to the visualization.
For example, we have added only “Sales Value” to the chart, but if we want to see the “Profit” value for the month, we cannot see this.
- Drag and drop the “Profit” column from the table to “Tooltip.”

- After adding the “Profit” column to the “ToolTips,” our chart remains the same. But when we hover over any month column bar, we can see sales and profit values for that particular month.

Once again, we have hovered over “November” month. Since we added the “Profit” column to the “Tooltips” field of the visual, we can see both sales and profit values.
- Similarly, now we will add the “Quantity” and “Discount” columns to the “Tooltips” area.

- Now once again, we will hover over the “November” month. We can see the data points of “Sales,” “Profit,” “Quantity,” and “Discount.”

Say hello to the new thing on your power bi dashboard.
Customize Data Points Results in Tooltip
We can customize the tooltip data point’s results as “Average” value, “Minimum” value, “Maximum” value, “Variance” value, etc.
- Click on the dropdown icon of the “Profit” column from the “Tooltips” and choose “Maximum” as the data point option.

- Now, if you hover over any of the bars in the chart, it will show only a particular month’s maximum profit value.

Like this, we can create a “Tooltip” for the visualization on the same page. But one more advanced thing we can do is create a visualization “Tooltip” from the different pages in Power BI.
Create Report Page Tooltip in Power BI
We have created a tooltip for the existing chart to show the “Profit” value, “Units Sold” value, and “Discount” value.
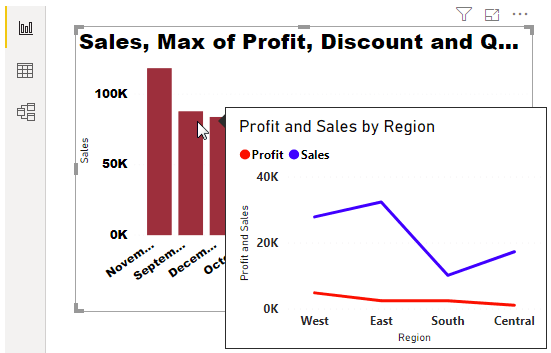
However, imagine if you want to show a region-wise profit vs. sale mini chart when you hover over any of the month bars.

Like the above image, we can show a visual tooltip as well.
Follow the below steps to create a report page tooltip in Power BI.
First, create a new page and name it as you wish.

On the newly created page, go to the “Format” pane.

Under this pane, click “Page size” and choose “Tooltip.”

In the same “Format” pane, click on “Page information” and turn on “Tooltip.”

Now, you can see the page is minimized. Make it as “Actual Size” under “Page View.”

Insert “Line chart “and drag the “Region” column to the “Axis” field and the “Profit” and “Sales” column to the “Values” field.

The profit and sales by region chart are below.
Now, return to the first page where we have created a clustered column chart, “Report Page.” On this page, select the visual and go to the “Format” pane.

In this “Format” pane, scroll down and turn on “Tooltip.”

Under this, select the page as “Tooltip Page.”

(Tooltip Page is the name of the new page we have created in step 1).


We have completed all the steps.
Now, come back to visual and hover over the column bars to see the “Tooltip,” which shows the region-wise sales vs. profit.

We have hovered over “October” month. For this month, we can see region-wise sales vs. profit.
Note: We have done so much formatting to these charts. You can download the Power BI tooltip file below and apply each formatting technique.
Things to Remember Here
- In Power BI, “Tooltip” is the way of showing more information about the category without adding those columns to the visualization.
- Under “Tooltip,” we can customize the kind of value we want to show in terms of “Average” value, “Maximum” value, “Minimum” value, etc.
- A visual tooltip is possible through Power BI’s “Report Page” tooltip.
Recommended Articles
This article is a guide to Power BI Tooltip. Here, we discuss how to create and customize tooltips in Power BI to show extra data labels in visuals, examples, and downloadable templates. You can learn more about Power BI from the following articles: –