Pivot Table in Power BI
PivotTable is simply the tool to create a summarized report from a large set of databases. It is the thing we all have done in MS Excel. So in such a way, can we use the pivot table in Power BI and the common question everybody asks? So in this article, we will show you how to use the “Pivot Table” kind of analysis in Power BI. But in Power BI, we do not have a PivotTable but similar visuals to show the summary report.
How to Create a Pivot Table in Power BI?
Below is the data we will use to create a PivotTable.
You can download the workbook and can use it to practice with us.
- Upload the data to the Power BI file.

- Return to the “Report” tab to create a summary table.

- From the visualization, the list inserts the “Matrix” visual.

This matrix visual has the below fields.

- Rows are nothing but “Row-wise” what we want to see.
- Columns are nothing on “Column-wise” what we want to see.
- Values mean which column values we need to see as a summary table.
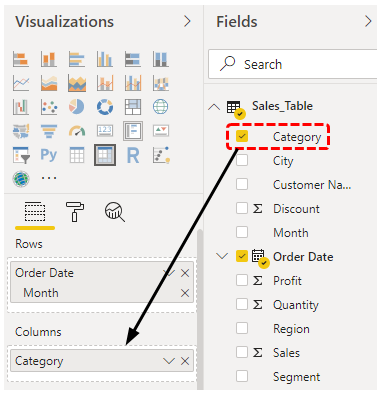
- For example, assume we want to see “Monthly” “Category-wise” sales value. First, drag and drop the “Date” column to the “Rows” field.
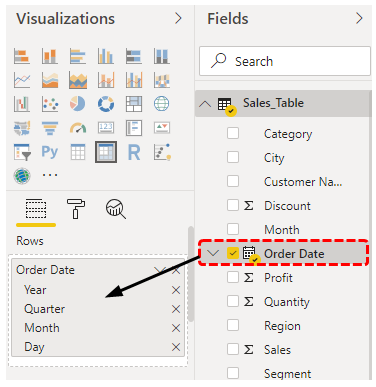
- As we see above, we can see “Year,” “Quarter,” “Month,” and “Day” since we need to see the monthly summary cancel all except “Month.”
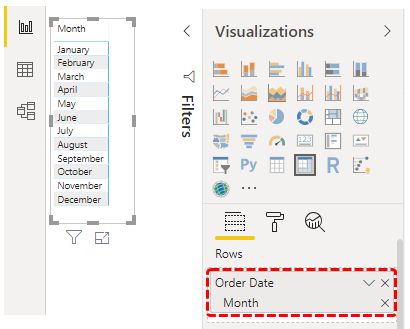
- Drag and drop the “Category” column to “Columns.”
Now, we could see a table like this.

- As we need to see a “Sales” column summary, we must drag and drop the “Sales” column to the “Values” field of the “Matrix” visual.
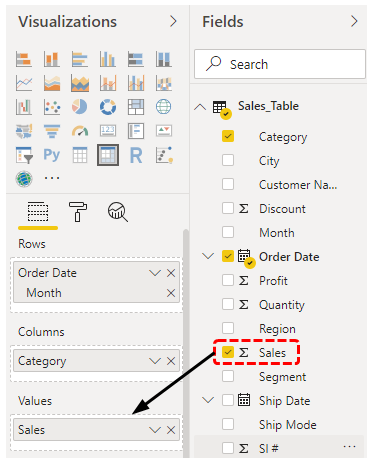
It will bring us the summary table, which looks like the “PivotTable” in Excel.

It is not the PivotTable but a summary table using Matrix visuals. We cannot add any further fields to it, but by using “Slicers,” we can view the drill down summary. For example, assume you want to see each month’s “Sub category-wise” summary. We cannot field for each “Category” but rather insert a slicer visual from the visualization list.

- Drag and drop the “Sub Category” column for this Slicer field from the table.
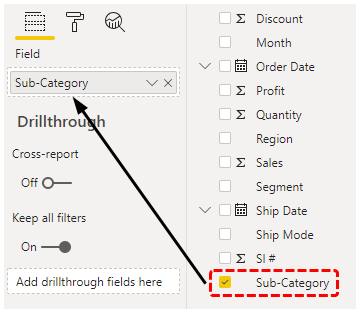
- Now, we can see “Sub-Category” names in the Slicer.

- Now, if we want to see only the “Copiers” sub-category summary table, then choose only “Copiers” from the Slicer, and it will filter the data in the “Matrix” table as well.
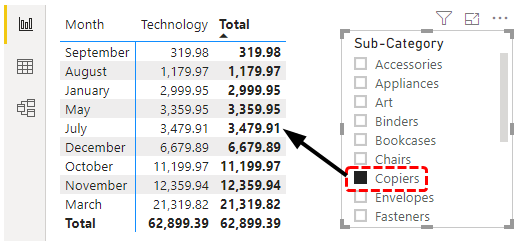
Like this, we can create a PivotTable kind of summary table.
Pivot and Un-Pivot Columns in Power BI Table
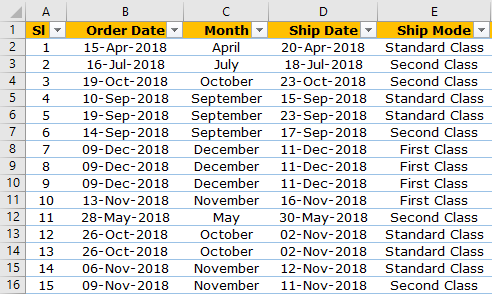
For example, assume the data you have in your Power BI file below.

As you can see above, it has a year name, month name, and their respective sales figures. In this case, each year appears 12 times for 12 months, so this is a repetitive task. So, we will pivot these columns and create a summary table.
- Step 1: Upload the file to Power BI. Under the “Home” tab, click on “Edit Queries.”

It will open up the “Power BI Query” editor window.

- Step 2: Choose the table and choose the “Month” column.

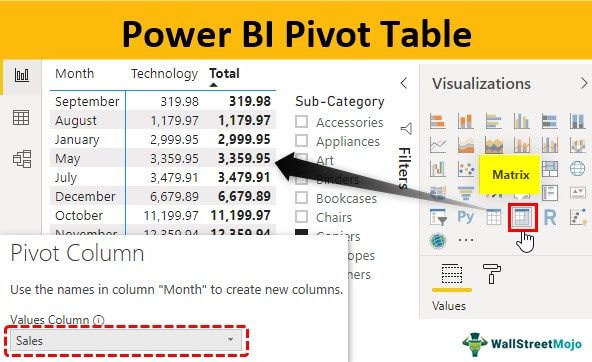
- Step 3: Under the “Transform” tab, click on “Pivot Column.”

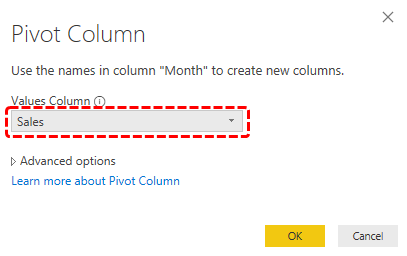
It will open the “Pivot Column” window.

- Step 4: From the above window, we need to choose “Values Column” as “Sales” because this is the column we are grouping.
- Step 5: Now, click on “OK.” It will pivot the columns.

- Step 6: Click “Close & Apply” to see the real result.

The real result is shown below.

So, we have eliminated multiple-year and month names to have a simple table, so we can manipulate the data using the “Pivot Column” option.
Similarly, we can unpivot columns as well.
- Assume below is the table you have.

We need to do the reversal of the above. Upload the data to Power BI and open the Power Query Editor.
- Step 1: From the “Power Query” window, choose the table and the “Year” column.

- Step 2: Under the “Transform” tab, click on “Un-Pivot >>> Unpivot Other Columns.”

It will unpivot columns.

Like this, we can use the “Power Query Editor” to pivot and unpivot columns.
Note: We can also download the Power BI file from the link below and view the final output.
Things to Remember
- PivotTable is not the tool available in Power BI but uses matrix visuals. We can create a summary table.
- We cannot expand or collapse items in Matrix visual, unlike MS Excel PivotTable.
- Pivot Table is not the tool available in Power BI but using matrix visuals, we can create a summary table.
- We cannot expand or collapse items in Matrix visual, unlike MS Excel Pivot Table.
- Using Power Query in Excel, we can pivot and un-pivot columns to manipulate the data as per requirement.
Recommended Articles
This article is a guide to Power BI Pivot Table. Here, we discuss how to create a PivotTable in Power BI. We also learn how to pivot and unpivot columns using a power query and examples. You may learn more about Power BI from the following articles: –