Power BI Vlookup
Not even a single Excel user says they are unaware of the function. That is the popularity of VLOOKUP in Excel. So, everybody doubts how to replicate the VLOOKUP function in Power BI. This article will detail how to replicate VLOOKUP in Power BI.
How to Replicate VLOOKUP in Power BI?
For example, assume you have three tables: “Sales,” “City,” and “Manager.”

You can copy the data to an Excel file and then import it to Power BI as an Excel file reference. You can also download the Excel workbook from the link below, which we have used for this example.
Upload these tables to Power BI.
In the “Sales_Table,” we do not have “Region Names” and “Manager” names, but to fetch the data from the other two tables, we have “City” as the common column or value among these tables.

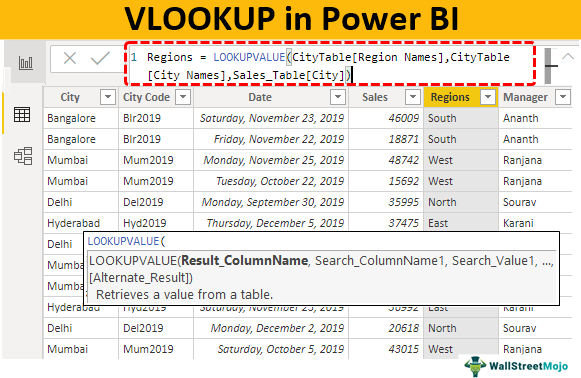
Using the LOOKUPVALUE DAX function, we can fetch the data from other tables to the “Sales Table.” Below is the syntax of the LOOKUPVALUE DAX function.

- Result_ColumnName: In this argument, we need to specify from which column we need the result? For example, if we are fetching the “Region” name from “City Table,” then the result column will be “Region Names” from “City Table.”
- Search_ColumnName: Based on which column we are searching the Result Column in the other table, i.e., in “City Table,” “City” is the base column.
- Search_Value: In the result required table (Sales_Table), based on which column we are searching for the result. In “Sales_Table,” “City” is the search base value.
Hint: Search_Column Name and Search Value should be the same in both tables.
For example, take the above tables.
- Go to the “Data” tab and choose “Sales _Table.”

- Right-click on the “Sales_Table” and choose “New column.”

- It will ask you first to name the column, so give it a name as “Regions.”

- Now, open the LOOKUPVALUE function.

- The first argument of this DAX function is “Result_Column Name.” So, from “CityTable,” choose the “Region Names” column.

- The next argument is “Search Column Name,” i.e., from “City Table” based on “City Names,” we are fetching the data, so choose the “City Names” column from “City Table.”

- The next argument is Search Value1, i.e., from the current table The “Sales_Table” base value is the “City Names” column, so choose the column.

Close the bracket and press the ‘”Enter” key. We will get a new “Sales Table” column as “Regions.”

- Similarly, we must fetch the “Manager Names” from the “Manager Table.” Again right-click on the “Sales_Table” and choose “New Column.” It will ask you to name the column, so give it a name as “Manager.”

- Open the LOOKUPVALUE function once again.

- This time we need the result from “Manager_Table,” so the Result_Column Name will be “Manager” from “Manager_Table.”

- Next, we need to select the Search_Column Name, i.e., from “Manager_Table” based on “City” we are fetching the data, so choose the “City” column from “Manager_Table.”

- Search Value will also be “City” name but from “Sales_Table.”

Close the bracket and press the “Enter” key to get the “Manager” names as the new column.

So, like this, using the LOOKUPVALUE DAX function in Power BI to replicate VLOOKUP in Power BI as well.
Alternative Way of Fetching the Data in Power BI
Using “Power Query,” we can merge or fetch the data from other tables.
- From the Power BI file under the “Home” tab, click on “Edit Queries.”

- It will open up the “Power Query” editor window. From this new window, under the “Home” tab, click on “Merge Queries.” Note: Select “Sales Table” and do this.

- It opens the “Merge” window.

- As of now, we can see “Sales_Table” is already selected. So, from the second dropdown list, choose “City Table.”

- We need to select the common columns from these two tables, so the common column between these two tables is “City” names, so select the same columns in both tables.

- Click “OK” to return to the “Query Editor” window.

- As you can see, it has created a new column, so click on the double-side arrow to see further options.
- It will show the below options.

- From this, select only “Regions” because in our “Sales_Table,” “City Names” column already exists, so unselect that.

Click on “OK” to get “Region” names.

- Repeat the same process to merge “Manager” names.

- After merging columns, click on “Close & Apply.”

Now, it will return to the Power BI file. Go to the “Data” tab to see new merged columns.

Note: You can download the Power BI VLOOKUP file from the below link and apply each formatting technique as applied.
Things to Remember Here
- The LOOKUPVALUE function is a VLOOKUP function to fetch the data from other tables in Power BI.
- The “Power Query” “Merge” option is the alternative way of fetching data from different tables.
- The LOOKUPVALUE function is a DAX function. Therefore, we must understand the parameters of the DAX function in power bi.
Recommended Articles
This article has been a guide to VLOOKUP in Power BI. Here, we discuss how to replicate VLOOKUP using the LOOKUPVALUE DAX function in Power BI with an example. You may learn more about Power BI from the following articles: –