Filters in Power BI
Power BI uses the filter function more to read the data or report based on multiple criteria. There are many filters in Power BI. This tool’s most commonly used filter is as follows:
Key Takeaways
- Visual level filters
- Page level filters
- Report level filters
- Drillthrough filters
- Applying a filter to the visual level
- Applying a filter to the page level
For example, if you have a monthly sales amount category-wise. Suppose you want to read the report only for specific categories across months. In that case, you can filter only those categories using filters, and dashboard visuals will show only selected category data in visuals.
Dashboards are good, and visuals can convey the message more efficiently. But, if the dashboard can interact with the user’s queries, that kind of dashboard can make the report dynamic. Power BI is software where we can make the dashboard interactive with the users.
If you have worked with an Excel worksheet, you do not need any special introduction to filters. But in Power BI, filters are more advanced and sophisticated and have many new features.
Similarly, if you do not want to see some items in the dashboard, we can also exclude those from the view.
Types of Power BI Filters
It is where Power BI is more powerful than the Excel filters because, in Power BI, we have several types of filters, which are as follows:
- Visual-Level Filters
- Page-Level Filters
- Report-Level Filters
- Drill through Filters
More importantly, if you are following an old version of Power BI, Microsoft recently launched a new filter update, which looks like this.
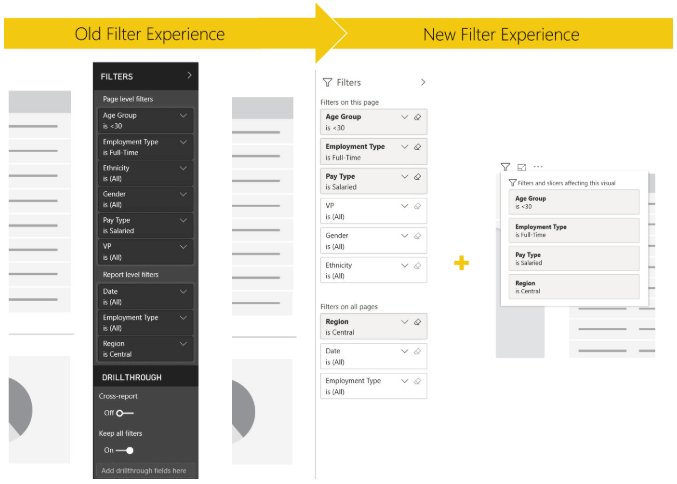
Source: https://powerbi.microsoft.com
How to Add Filters in Power BI? (Top 3 Types)
You can download the workbook used in this example to practice with us from the link below.
Example #1 – Visual Level Filter
It is the filter that works on an individual filter only. Therefore, the filter you apply based on that selected visual can show only that much in the visual. For example, look at the below image of two visuals.

These two visuals are the same, but to understand how a visual level filter works.
- On the right-hand side, you can see the “Filters” option.

- Since no visual is selected, we cannot see any data field in the filter. Now, select the second table to see the data fields.
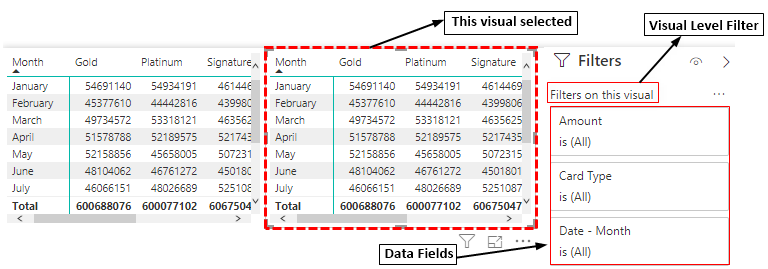
As you can see above, we can see the data fields of the selected visual. We have three fields: “Amount,” “Card Type,” and “Date – Month.”
- Click on the dropdown list of “Date – Month” and choose only “Jan,” “Feb,” and “Mar.”

- Now, look at both the visuals.

Only Table-2 data has been filtered for selected months, and Table-1 visual data remains the same. So, when the filter can impact specific visual effects or data, that is called a “Visual Level Filter.”
Example #2 – Page Level Filter
This filter works on all the visuals which are there in the field. For example, look at the below visuals.
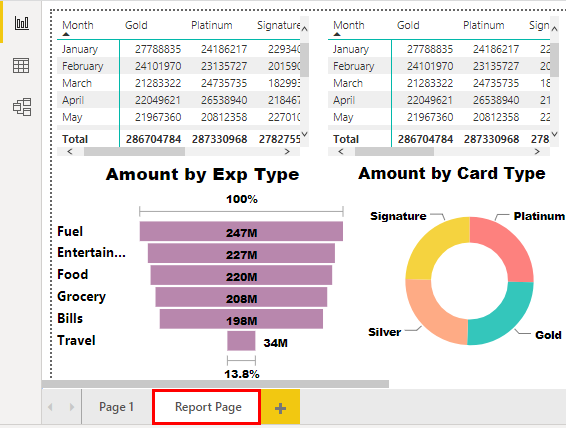
These are the visuals we have created on the page named “Report Page.” By using “Page Level Filters,” we can make the impact of the filter across all the visuals in the Power BI data.
- We usually have the “Filters” pane on the right-hand side.

Note: Since no visual has been selected, we cannot see any data fields.
Now, we must decide which data field to apply to the filter. But, first, we must drag and drop the respective field to the “Filters on this page” field.
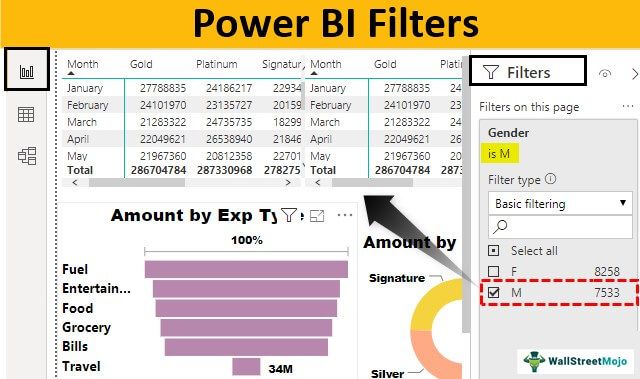
- We want to filter the page level visuals based on “Gender,” so we will drag and drop the field to the “Filter on this page” field.

- From this filter, “Gender” now chooses only “Male.”

- Now, look at the impact it has on visuals.

All the visuals show only “Male” gender-related data points.
- Another thing you can do with this filter has an option called the “Require single selection” checkbox. With this, we can choose only one item at a time.

Example #3 – Report Level Filter Function
This filter impacts all the pages of the report we are working on.
For example, if you have 3 pages. If you choose the option of applying a filter based on “Report Level,” it will impact all the pages’ visuals.
- You must drag and drop the required field to the “Filters on all pages.”

We have selected the “Card Type” data field. If we choose any filter, it will affect all the files’ reports.
Note: We can also download the Power BI filters file from the link below. We can view the final output.
Things to Remember here
- The Power BI filters are more advanced than Excel worksheet filters.
- We mainly work with three filters: Visual Level, Page Level, and Report Level Filter.
- We must understand what kind of impact each filter would do.
Recommended Articles
This article has been a guide to Power BI Filters. Here, we discuss the top 3 types of Power BI filters and how to add them to reports, along with an example and downloadable templates. You can learn more about Power BI from the following articles: –