What Does SUMX Function Do in Power BI?
SUMX is an iteration function in Power BI that works on a row-by-row calculation per the given expression or equation. This function considers each row at a time and applies the calculation. It will not concentrate on the entire column, unlike the SUM function. But, it works like a cell be cell formula in Excel. SUM is an aggregate function, and SUMX is an expression function. One can perform Power BI data manipulation by using DAX functions, and SUMX is one such function in Power BI. This article will take you through the SUMX in Power BI.
Below is the syntax of the SUMX function in Power BI.
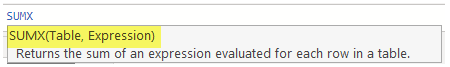
Table: We first need to supply the table name for which we supply the SUMX function.
Expression: After the table, we need to provide the Expression or Equation to do row-by-row.
To supply Power BI SUMX, you need data to work with, so you can download the Excel workbook template from the link below, which we have used for this example.
Examples of SUMX Function in Power BI
Below are some examples of the SUMX function in Power BI.
SUMX in Power BI – Example #1
Look at the below simple table.
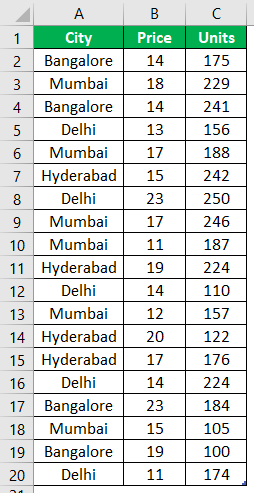
- In the above table, we have units and price per unit but do not have the total sale value. So, by using Power BI SUMX, we will determine the sale value.
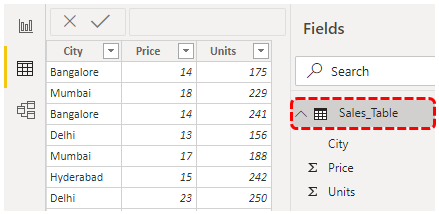
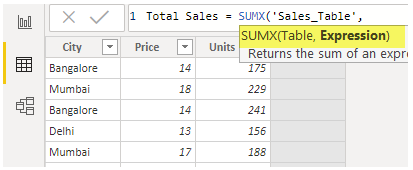
- Upload the data table to Power BI and name the table “Sales_Table.”
- We need to calculate the “Total Sales” column as a new calculated column. Right-click on the table name and choose “New column.”

- Name the new column “Total Sales.”

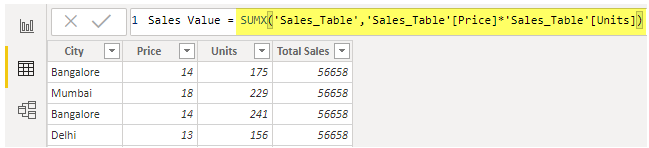
- Open the SUMX function now.
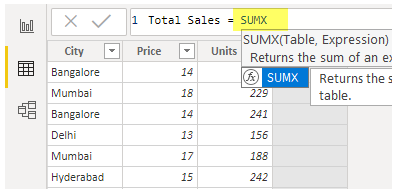
- First, we need to supply the table name since our table name is “Sales_Table,” supply the same.
- The expression is the equation we need to do.
- So, we need to find the “Total Sales” value by multiplying “Units” with “Price.”
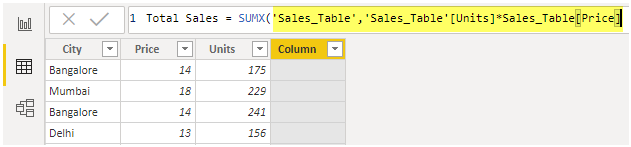
- Close the bracket and press the “Enter” key to get the result in the new column.
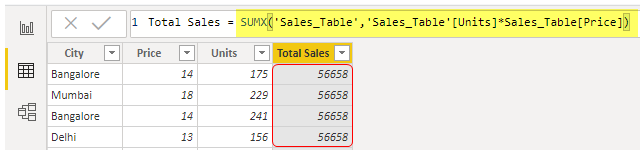
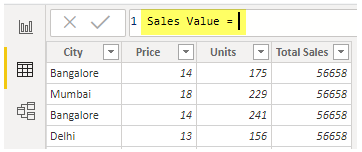
It shows total sales as 56,658 for all the rows because we have used SUMX to arrive at the new column. It has given us the overall total amount for all the rows. So, to arrive at each row calculation, we need to apply the Power BI SUMX function in “New measure,” not in “New column.”
- Right-click on the table and choose “New measure.”

- Give measure a name as “Sales Value.”
- Now, apply the SUMX function in Power BI.
- Now, come back to the “Report” tab.
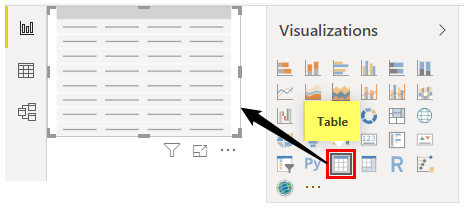
- Insert “Table” visual from the “Visualizations” list.
- Drag and drop “City” and “Sale Value” to get the summary table.
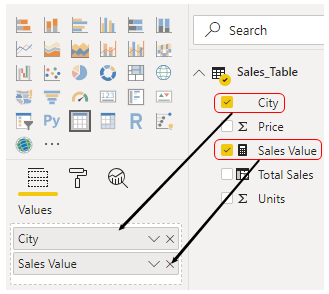
- It gives us the exact result but drag and drop the first calculated column, “Total Sales,” to see the results city-wise.
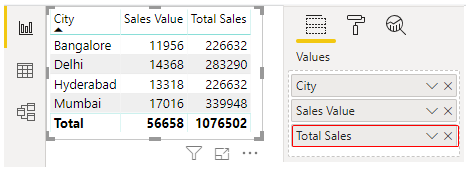
It is giving us blunder results because it adds overall value for all the cities in each row, so this is the wrong way of applying the SUMX function in Power BI.
SUMX in Power BI – Example #2
For the same table, we will do additional calculations. For example, assume that we will deduct 5% for every transaction as the handling charges.
- Right-click on the table, choose “New measure,” and give the name “Sales After Charges.”
- Enter the below formula now.
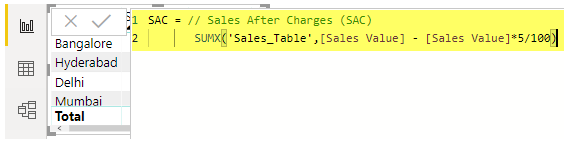
- Click on the “Enter” key. We will have a new measure.
- Drag and drop the measure to the table to see the difference.
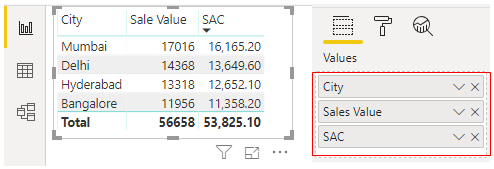
As you can see, now we have “Sale Value” before deducting charges and “Sale After Charges” (SAC). For example, for “Mumbai,” “Sale Vale” was 17,016 after deducting 5% charges. It is 16,165. i.e. Mumbai = 17,016 – (17016 * 5/100) = 16,165.
SUMX in Power BI – Example #3
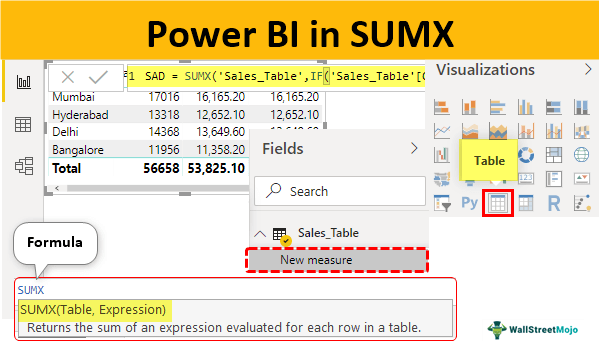
Now, we will see nested calculations. For example, assume wherever the city name is “Bangalore,” we will give an additional ₹500 discount. If not, the Bangalore discount will be zero.
- So, now we need to find the “Sale After Discount” (SAD).
- Apply the below measure to find the SAD.
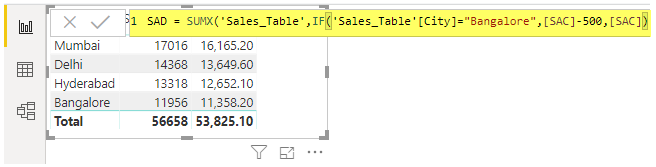
Let me explain to you the formula in detail.
- In the “Sales_Table,” If the city is “Bangalore,” then we need to deduct ₹500 from “Sales After Charges” (SAC). Otherwise, we need the result to be the same as “Sale After Charge” (SAC) only.
- Drag and drop the new measure into the existing table to see the difference.
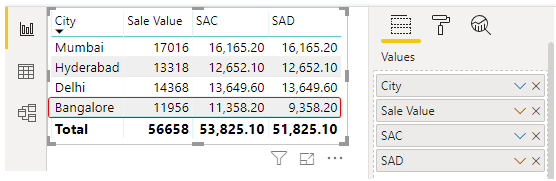
- As you can see above, only for “Bangalore” city sales amount has been changed. For other cities, it remains the same as the left column, “SAC Value.”
Note: To apply conditional formatting, we need data. You can download the Power BI file to get the ready table.
Things to Remember
- The SUMX function in Power BI calculates row-by-row calculations.
- The SUMX function does the calculation as per the equation provided for expression.
- Each row will be affected by the SUMX function.
Recommended Articles
This article has been a guide to SUMX in Power BI. Here, we discuss using Power BI’s SUMX function, examples, and downloadable Excel templates. You can learn more about Power BI from the following articles: –