Part of our Valuation Methods guide
What Is Forward PE Ratio?
The forward PE ratio uses the forecasted earnings per share of the company over the next 12 months for calculating the price-earnings ratio. It is calculated by dividing the price per share by forecasted earnings per share over the next 12 months.
Forward PE Ratio Excel Template
Download Excel Template
The forward PE ratio differs from the company’s PE ratio in terms of the calculation done. In the PE ratio, one uses the earnings of the previous year. However, the projected earnings for the next year are considered in the forward PE.
Key Takeaways
- The forward PE ratio includes the forecasted earnings per share of the company over the next 12 months for determining the price-earnings ratio.
- One may calculate it by dividing the price per share by forecasted earnings per share over the next 12 months.
- The first component is the market price per share. The market price may change and vary over time. Hence, we must divide the market price by the number of the company’s outstanding shares to calculate the market price per share.
- The second element is the projected earnings per share. An investor may see various publications to know about the projected earnings. Otherwise, they may appoint a financial analyst and take help to determine an estimate.
Forward PE Ratio Explained
The forward PE ratio, like the PE ratio, is also a great measure of whether a company is financially healthy. But every investor needs to look at a bunch of other financial ratios along with this forward ratio to conclude whether they should invest in a company.
A good forward PE ratio falls in the range between 10 and 25, which is also considered a significant PE ratio for stocks in the market. Anything below 10 creates doubt among investors as that implies not a very good financial state of any company. On the other hand, above 25 is too expensive a ratio to go for and it is considered an unreasonable growth.
Video Explanation Of Forward PE Ratio

Formula
As stated above, the formula of the forward price earning ratio is just an extension of the formula of the PE ratio.
Let us have a look at the formula below –
Forward PE Ratio = Market Price per Share / Projected Earnings per Share
How To Calculate?
Here one needs to consider two components.
- The first component is the market price per share. As the market price (at which the potential shareholder would buy the company’s stocks) can change over time, the market price would vary. Therefore, we need to divide the market price by the number of outstanding shares of the company to determine the market price per share.
- The second component is the projected earnings per share. As an investor, you can look at different publications to learn about the projected earnings. Else, you can hire a financial analyst and take her help to find out an estimate.
We can calculate forward earnings per share using the following formula: –
Forward EPS = Projected Earnings / Numbers of Outstanding Shares of Company
This formula will also help investors know how much a company will earn per share. Then, they can use the same formula to find out about the forward PE ratio.
Examples
Let us take two examples to understand the forward PE ratio meaning and working. The first one is a simple one, while the second example is a bit complex.
Example # 1
Jill is new to stock investing. She wants to know whether she should invest in Burban Ltd., a biscuit company. So, she asks her brother, who has been in stock investment for quite a while. Jack, her brother, advises that she should look at many financial ratios. Jill figured out all the ratios except the forward price earning ratio. Help Jill find out the ratio using the following information: –
- Total Market Price of the stock – $1 million
- Number of shares outstanding – 100,000
- Projected Earnings for the next year – $500,000
We will calculate the forward PE ratio by splitting the example into two parts.
First, we will calculate the market price per share, then find the forward EPS.
- Market price per share = Total market price of the stock / Number of shares outstanding
- Or, Market price per share = $1,000,000 / 100,000 = $10 per share.
To find the forward EPS, we need to use the following formula:
- Forward EPS = Projected Earnings for the next year / Number of shares outstanding
- Or, Forward EPS = $500,000 / 100,000 = $5 per share.
Using the forward price-to-earnings ratio formula, we will get –
- Forward PE Ratio = Market price per share / Forward EPS
- Forward PE Ratio = $10 / $5
- Forward PE Ratio = 2.
Example # 2
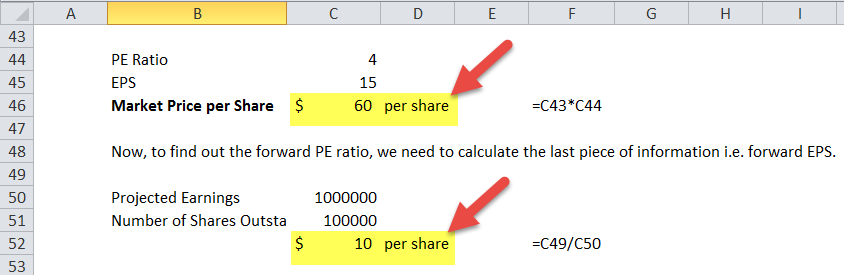
Mr. Amit wants to calculate the forward price earning ratio of Buddha Jeans Ltd. The issue is he does not have all the information. He only knows the PE ratio of the company and also the EPS. He also has a consensus report that says that the projected earnings of Buddha Jeans Ltd. would be $1 million in the coming year. Help Mr. Amit find out this ratio by using the following information: –
- PE Ratio – 4.
- EPS – $15 per share.
- The number of outstanding shares – is 100,000.
We have been given the PE Ratio and EPS. So, let’s break them down.
- PE Ratio = Market Price per Share / EPS
- We know the PE Ratio is 4, and the EPS is $15 per share.
So, using the same information, we now get –
- 4 = Market Price per Share / $15
- Or, Market Price per Share = 4 * $15 = $60 per share.
To find this ratio, we need to calculate the last information, i.e., forward EPS.
We will use the following formula to find out the forward EPS: –
- Forward EPS = Projected Earnings / Number of Shares Outstanding
- Forward EPS = $1 million / 100,000
- Forward EPS = $10 per share.
We have all the information we need,
- Forward Price Earning Ratio = $60 per share / $10 per share
- Forward Price Earning Ratio = 6.
Forward PE Ratio of Amazon
Amazon Current Share Price = 1,586.51 (as of 20th March 2018).
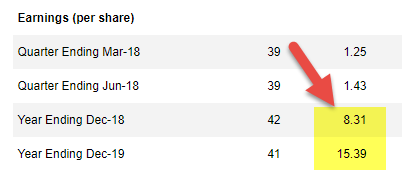
Forward EPS
2018 = $8.31
2019 = $15.39
- Ratio (2018) = Current Price / EPS (2018) = 1,586.51/8.31 = 190.91x
- Ratio (2019) = Current Price / EPS (2019) = 1,586.51/15.39 = 103.08x
Forward PE Calculator
You can use the following Forward PE calculator.
Forward PE Ratio in Excel
Let us now do the same example above in Excel. It is straightforward. First, we need to calculate the market price share and forward EPS, then calculate the ratio. You can easily calculate the ratio in the template provided.
We will calculate it by splitting the example into two parts.

Now, we use the formula we will get-

Example #2
We have all the information we need to determine the forward PE ratio.

You can download this Template here – Forward PE Ratio Excel Template.
Frequently Asked Questions (FAQs)
What is a good forward PE ratio?
An excellent forward PE ratio is between 10-25 for major stocks since stocks with a forward PE below 10 can often be a value trap. On the other hand, those above 25 can be too expensive as they are priced with irrationally high growth anticipations.
What is Tesla’s forward PE ratio?
The PE ratio is estimated by considering the last closing price and dividing it by the most recent earnings per share (EPS) number. It is a simple approach to determine if a stock is over or undervalued. It is the most used valuation technique.
Is forward PE reliable?
Forward PE is the price-to-earnings (PE) ratio that considers forecasted earnings for the P/E computation. It is an estimate and less reliable than current or historical earnings data. In addition, there are more advantages to estimated PE analysis.
What does negative forward PE ratio mean?
A negative PE ratio refers to the company reporting either no earnings per share (EPS) or negative EPS. Generally, the company has made no profit over the last 12 months.
Recommended Articles
Continue with these closely related articles from the same guide.